1. Overview
The CpGtools package provides a collection of Python programs designed to annotate, perform quality control (QC), visualize, and analyze DNA methylation data generated from the following Illumina platforms:
The CpGtools modules are organized into four main categories:
CpG position analysis modules
CpG signal analysis modules
Differential CpG analysis modules
Predictive modules (under development)
1.1. CpG Position Analysis Modules
These modules focus on analyzing CpG genomic locations and their annotations.
Name |
Description |
Aggregate proportion values of CpGs that located in give genomic regions (eg. CpG islands, promoters, exons, etc.). |
|
Add annotation information CpGs according to their genomic coordinates. |
|
Add annotation information to 450K/850K probes. |
|
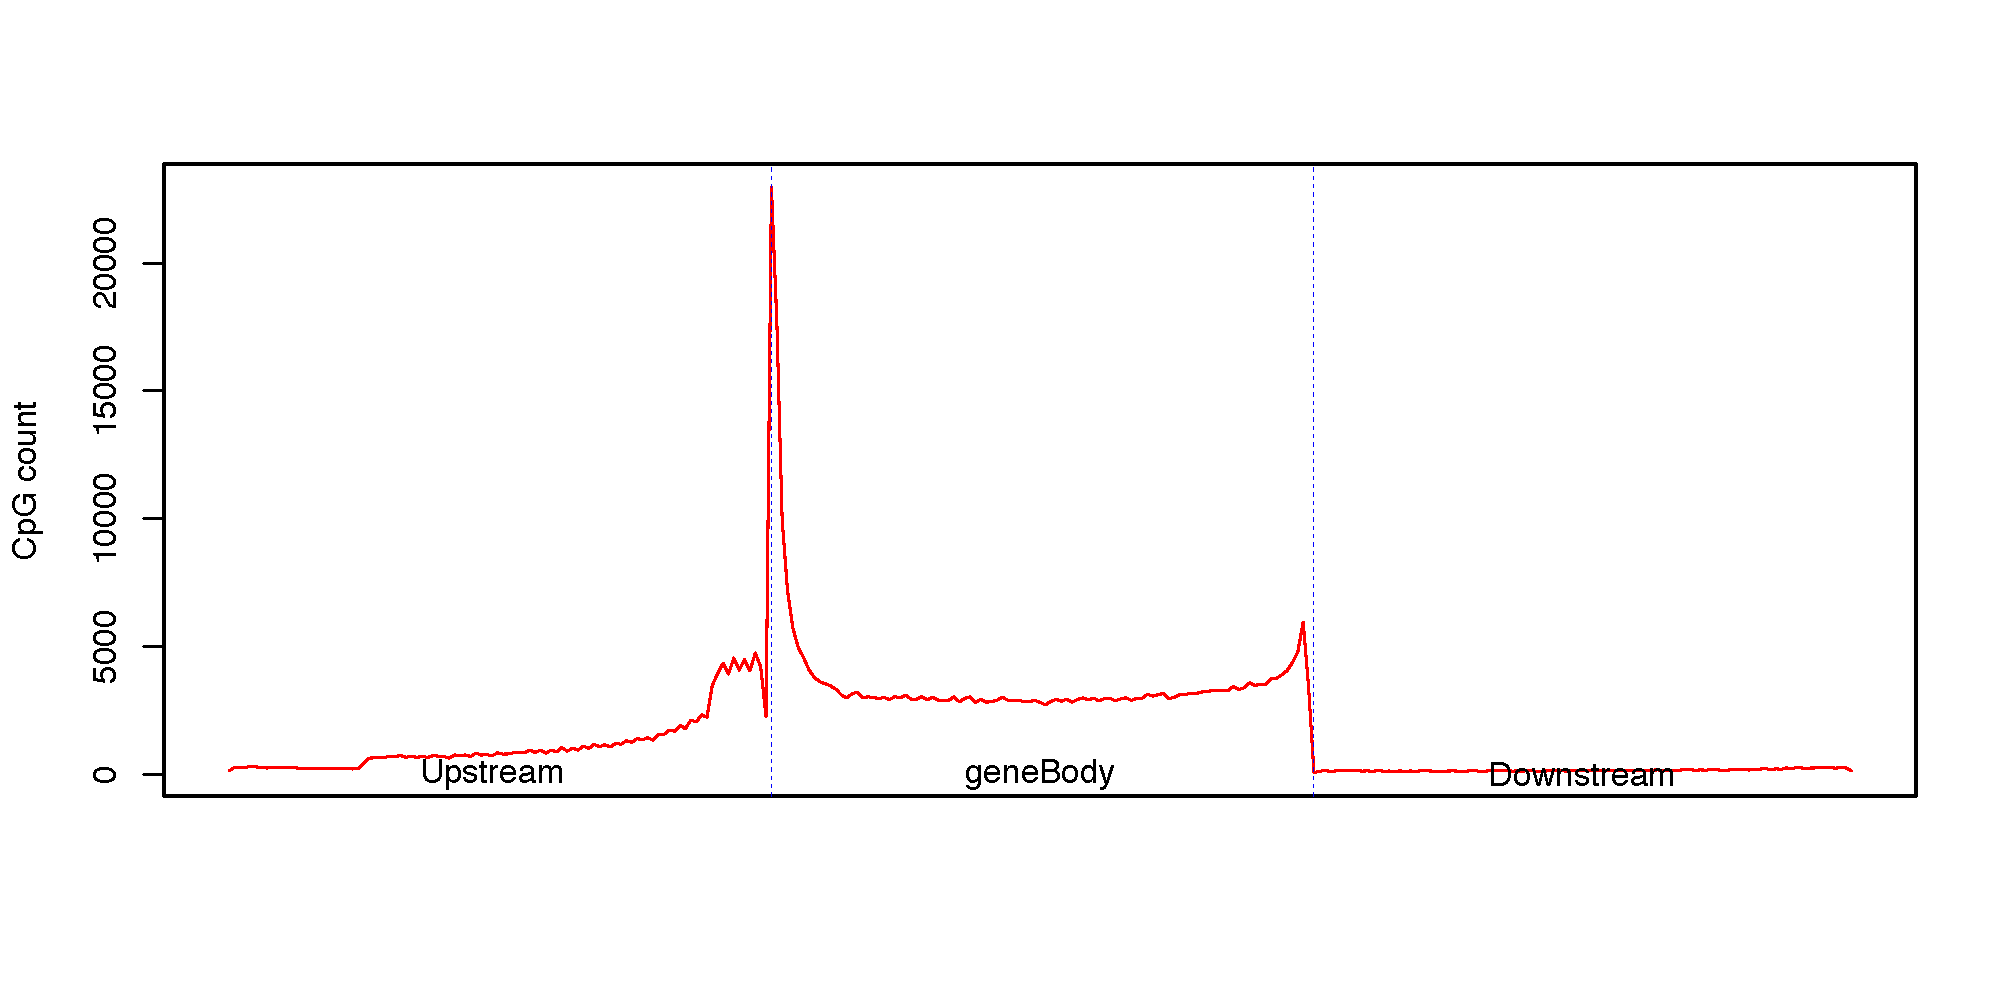
Generate the CpG density (count) profile over gene body and the up/down-stream intergenic regions. |
|
Calculate the distribution of CpG over chromosomes. |
|
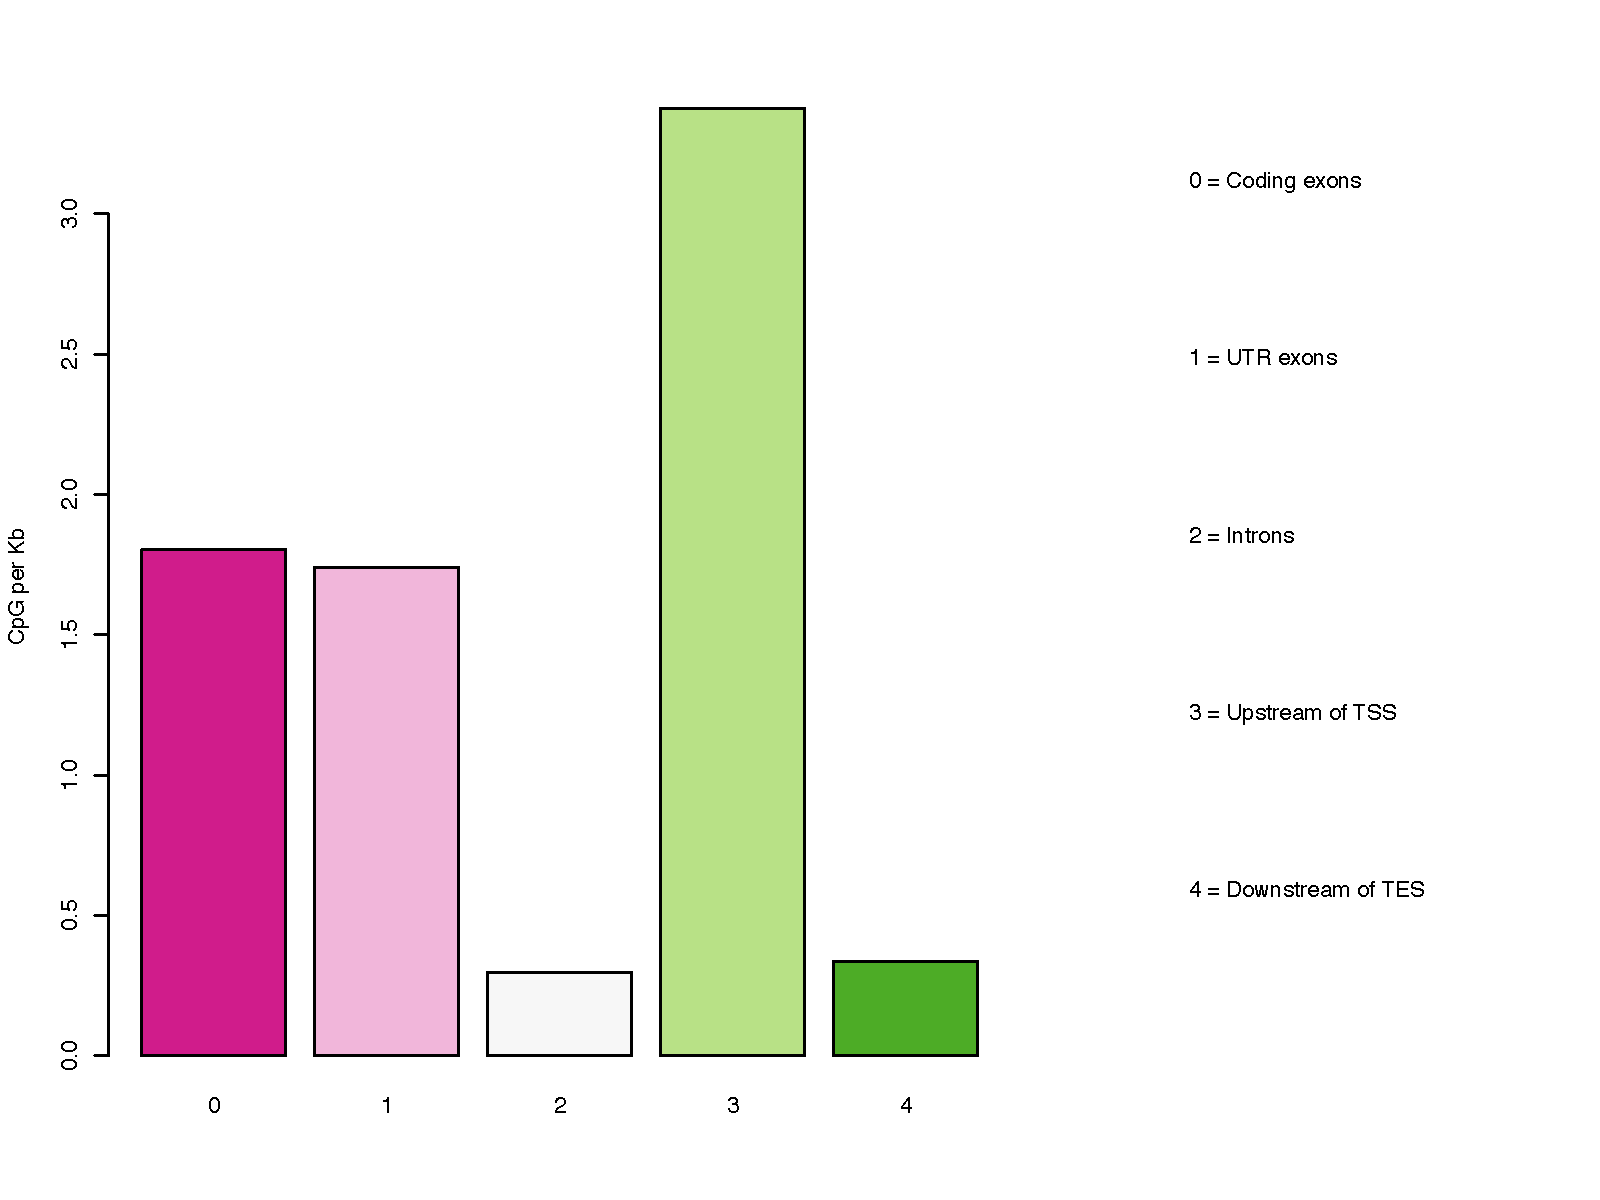
Calculate the distribution of CpG over gene-centered genomic regions. |
|
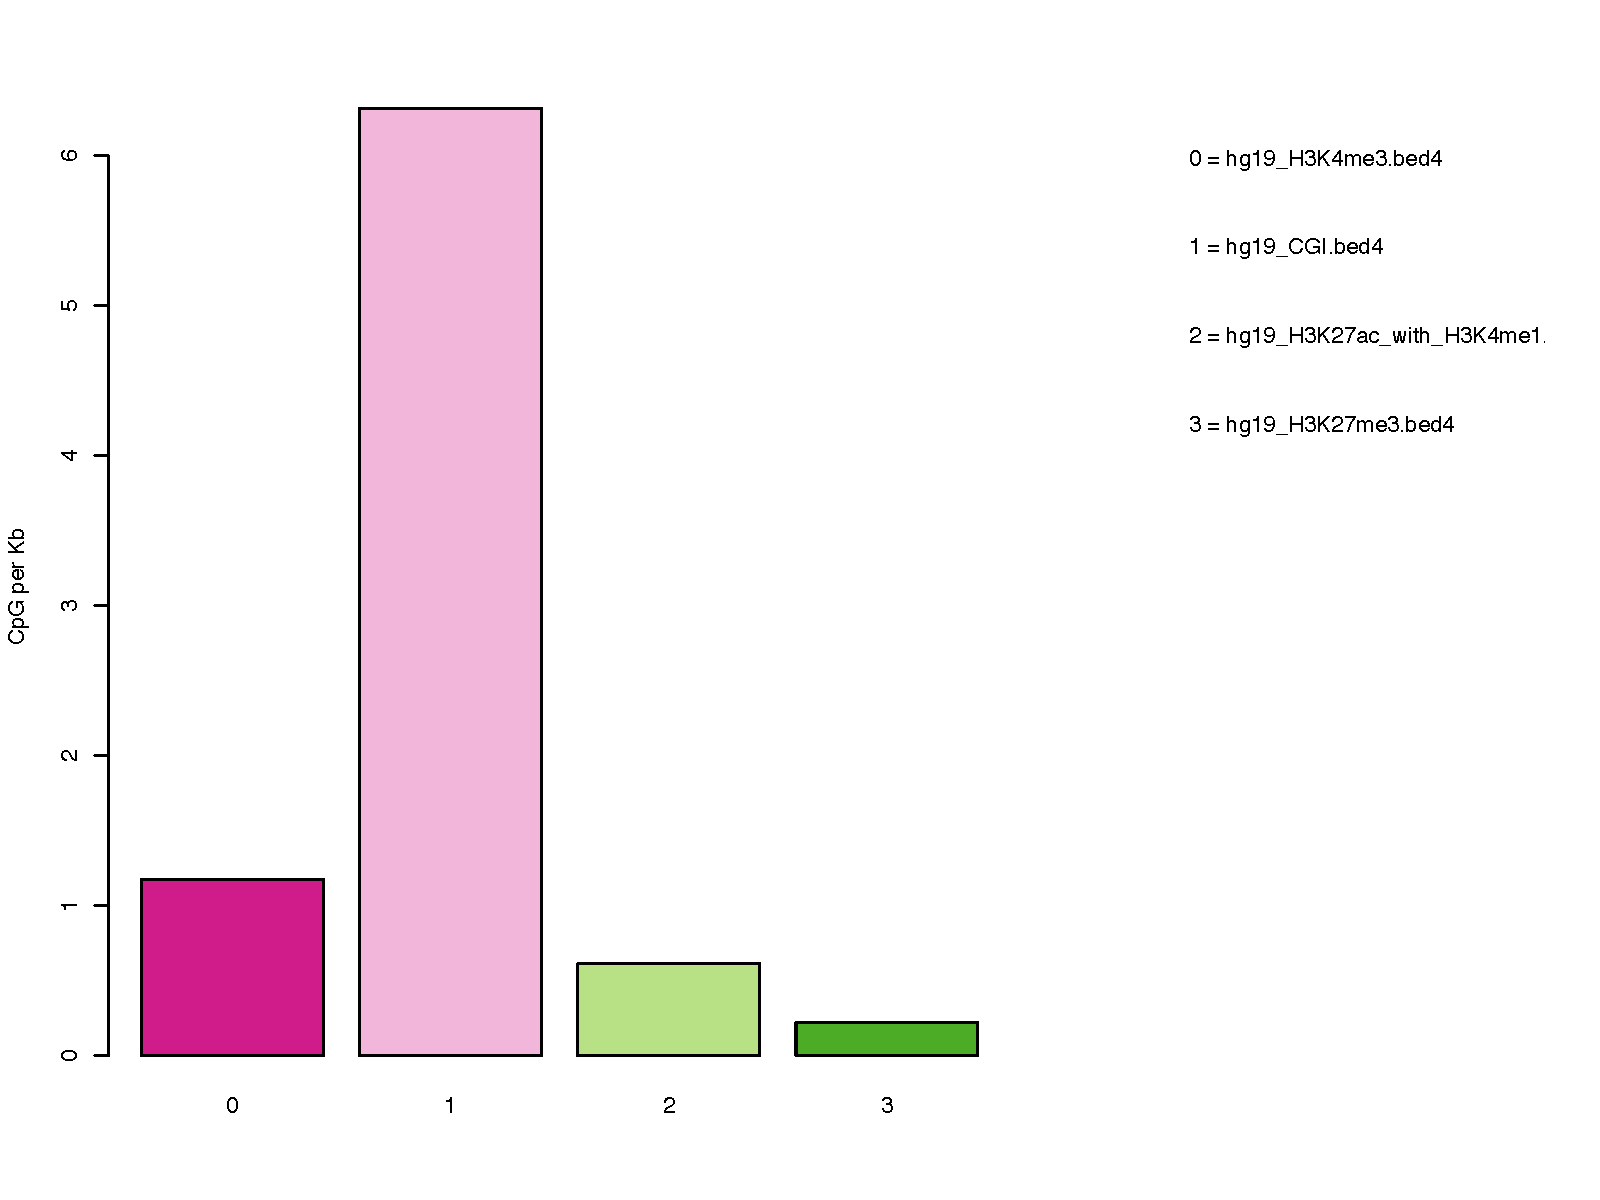
Calculate the distribution of CpG over user-specified genomic regions. |
|
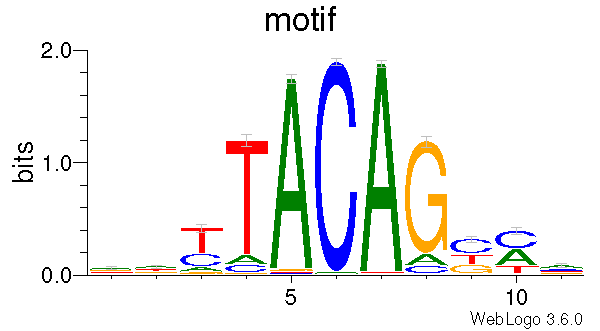
Generate a DNA motif logo and matrices for a given set of CpGs. |
|
Assign CpGs to their putative target genes. It uses the algorithm similar to GREAT. |
1.2. CpG Signal Analysis Modules
These modules analyze CpG methylation beta values across samples and genomic regions.
Name |
Description |
Perform PCA (principal component analysis) for samples. |
|
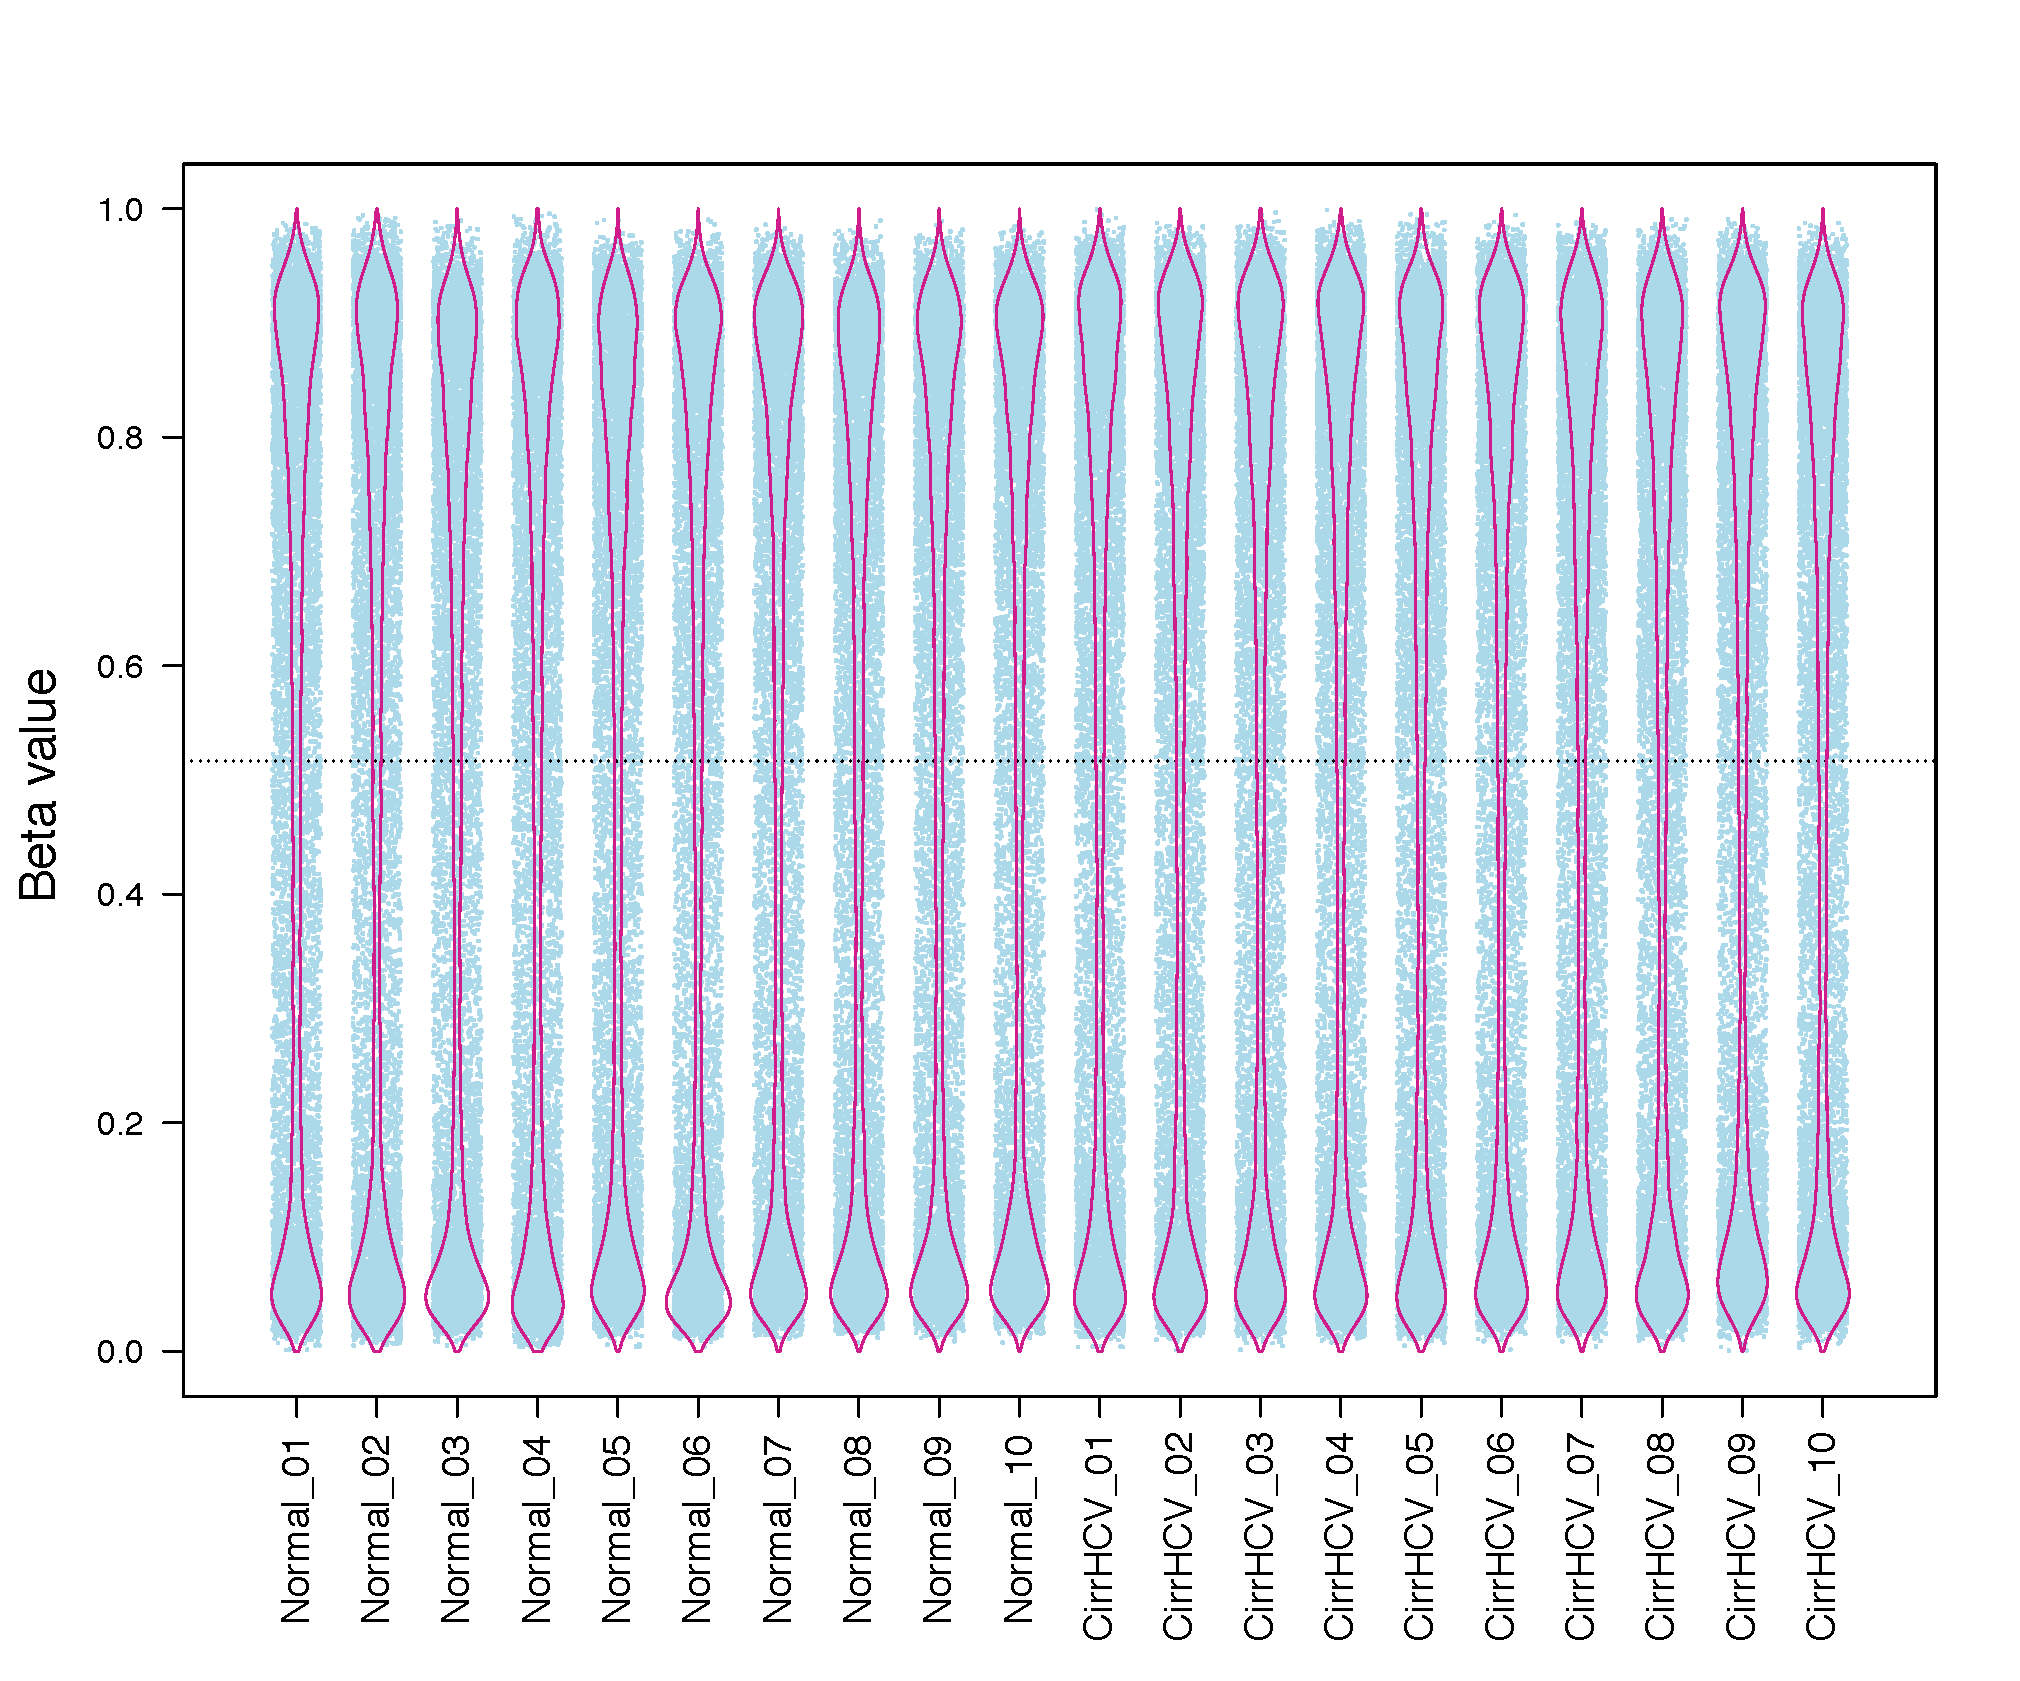
Generate jitter plot (a.k.a. strip chart) and bean plot for each sample.” |
|
Convert Beta-value into M-value or vice versa. |
|
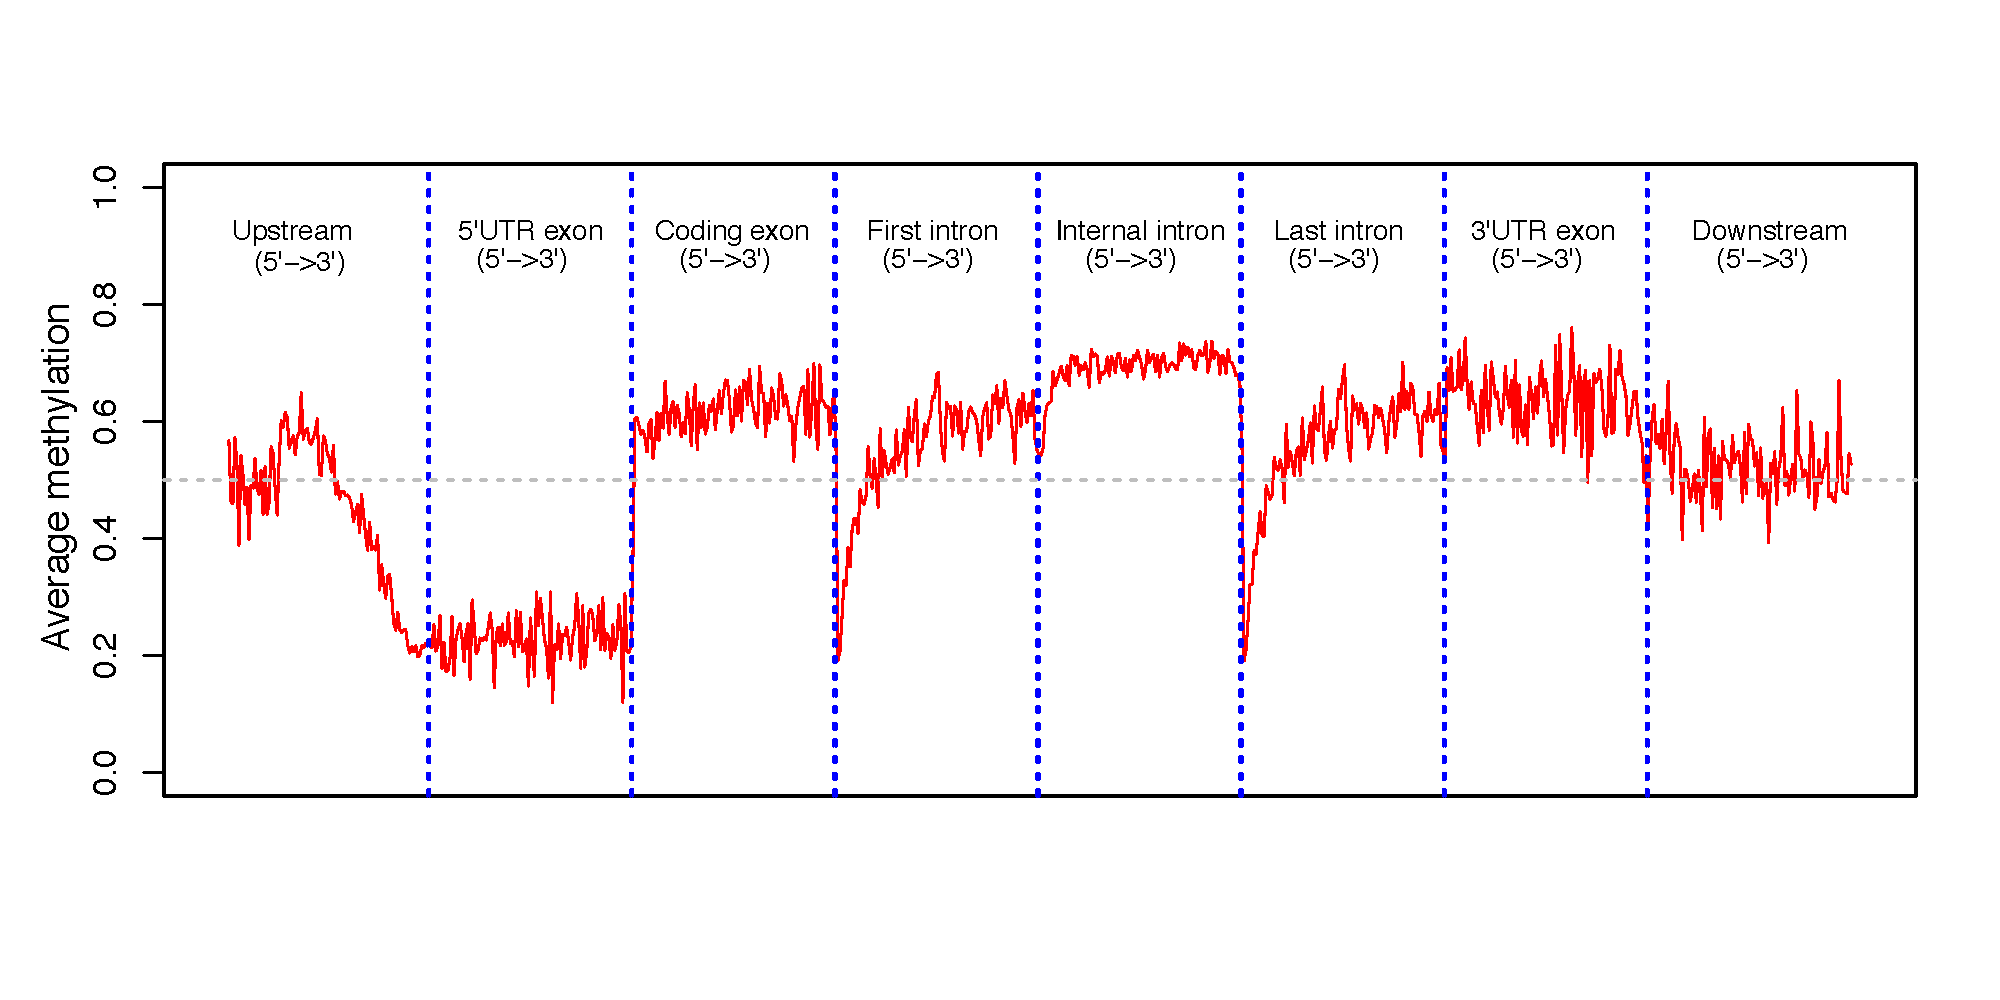
Calculate the methylation profile (i.e., average beta value) for genomic regions around genes. |
|
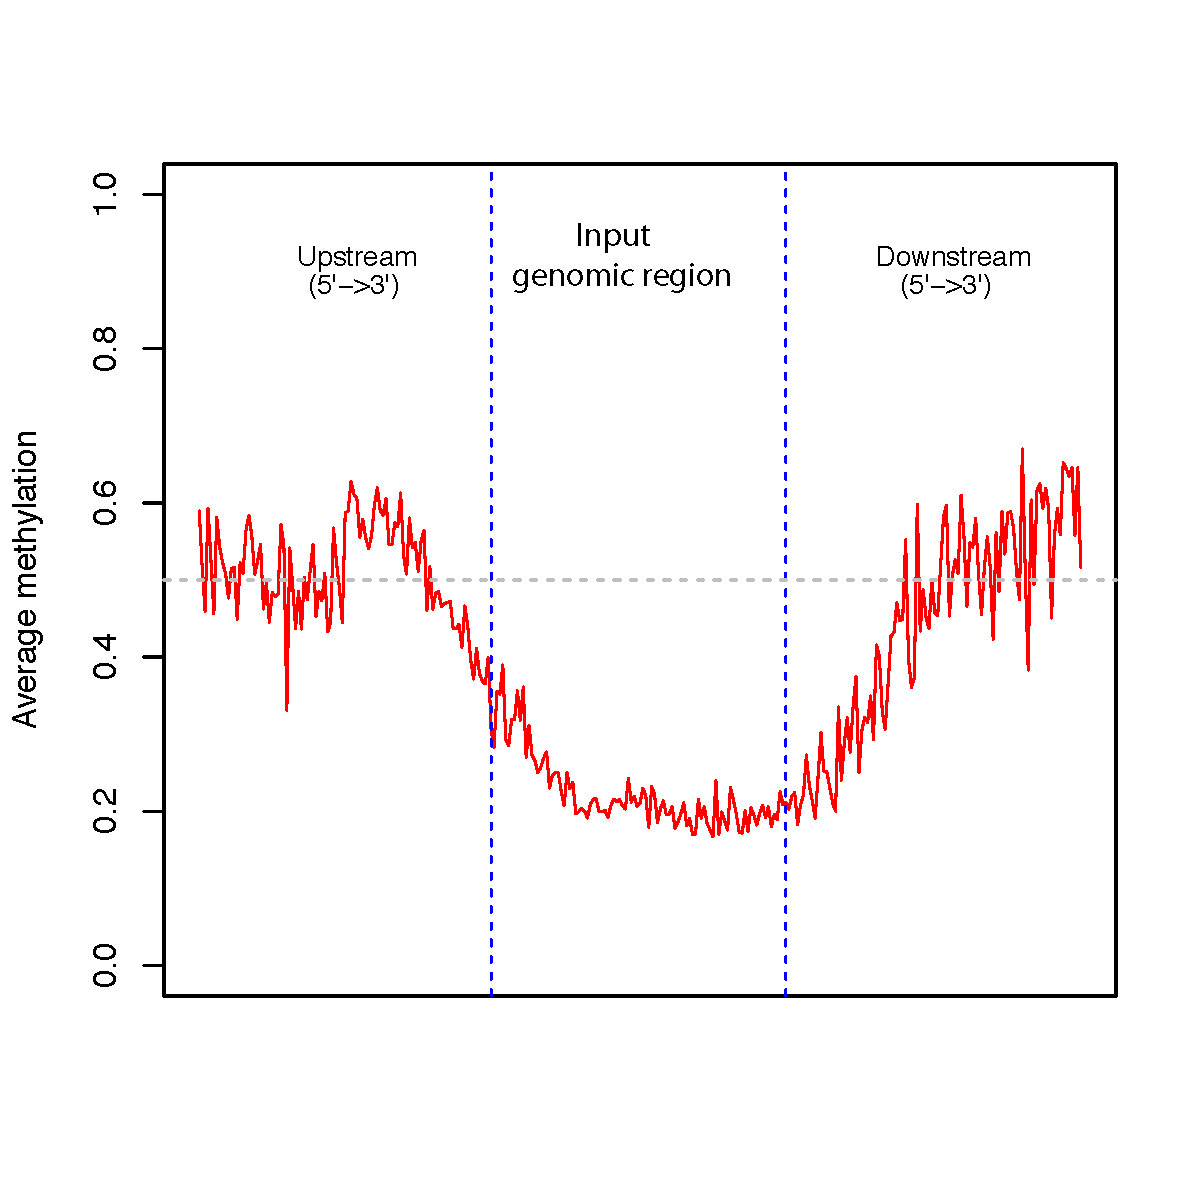
Calculate methylation profile (i.e. average beta value) around the user-specified genomic regions. |
|
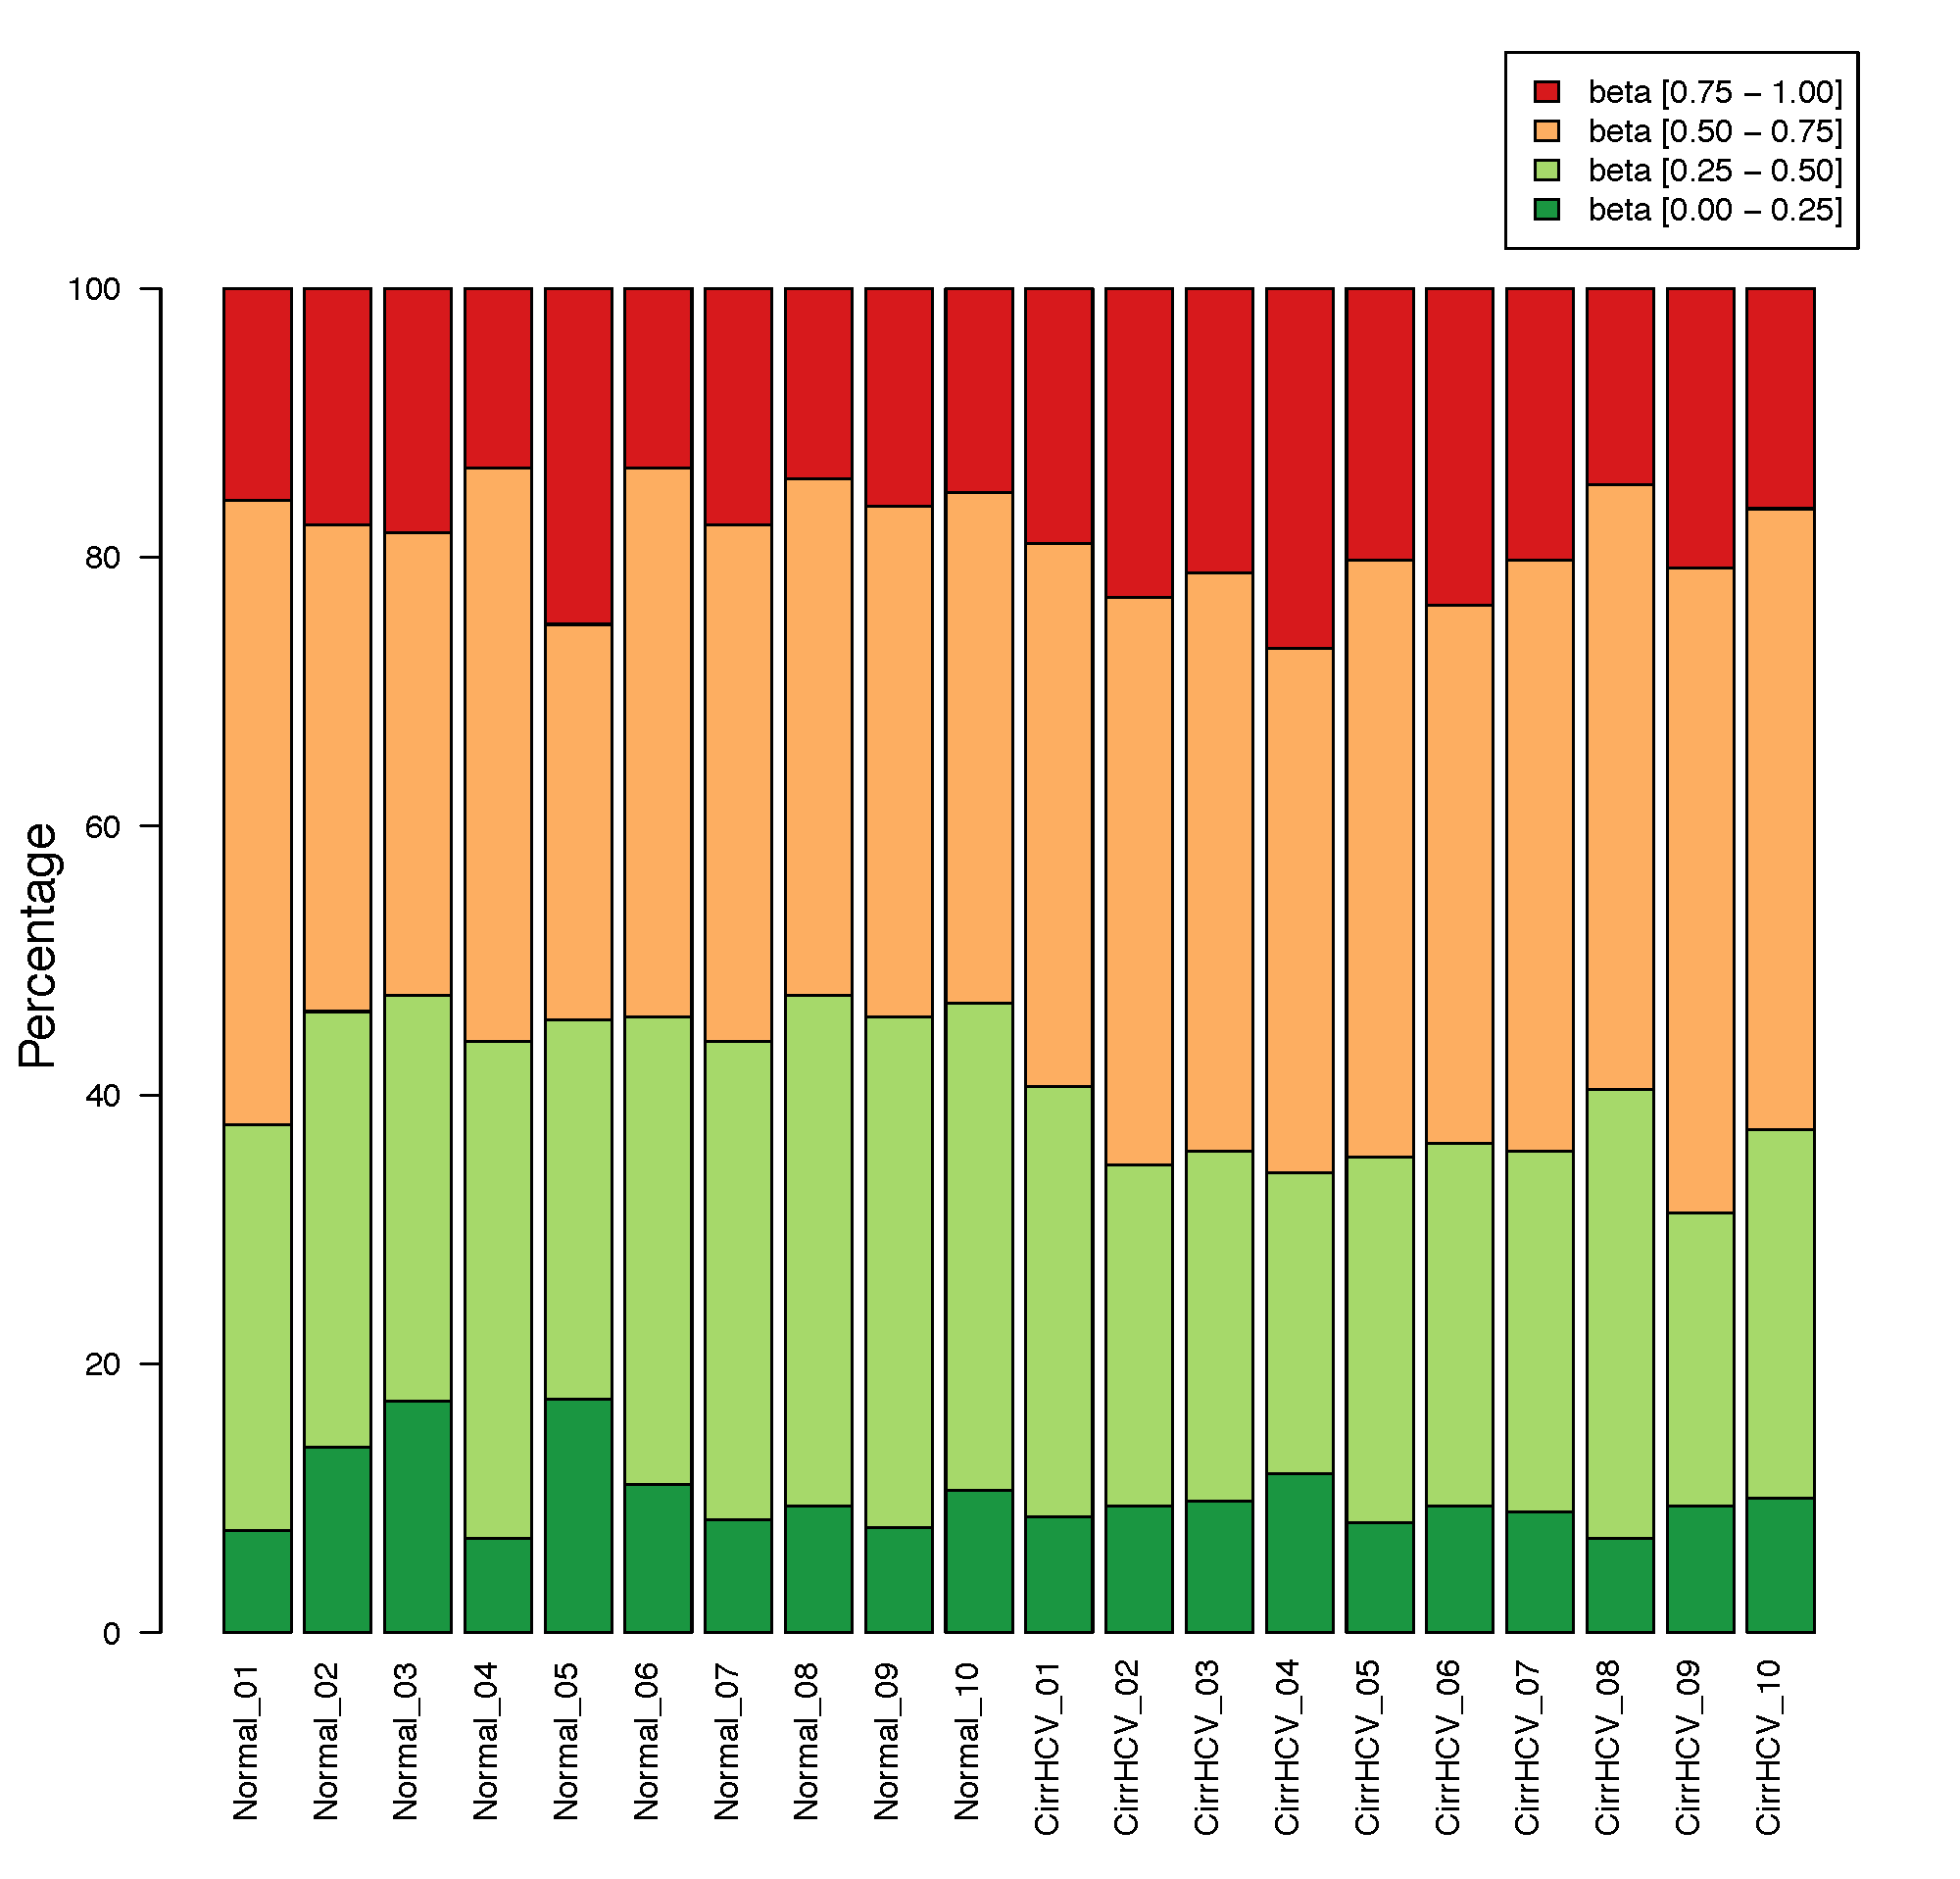
Create stacked barplot for each sample. The stacked barplot showing the proportions of CpGs whose beta values are falling into [0,0.25], [0.25,0.5], [0.5,0.75],[0.75,1] |
|
Summarize basic information on CpGs located in each genomic region. |
|
Perform t-SNE (t-Distributed Stochastic Neighbor Embedding) analysis for samples. |
|
Select the top N most variable CpGs (according to standard deviation) from the input file. |
|
Use Bayesian Gaussian Mixture model to trichotmize beta values into three status: ‘Un-methylated’,’Semi-methylated’, ‘Full-methylated’, and ‘unassigned’. |
|
Perform UMAP (Uniform Manifold Approximation and Projection) for samples. |
|
Select the K best features using ANOVA, Mutual information or Chi-squared stat. |
|
Corrects batch effect using the combat algorithm. |
—
1.3. Differential CpG Analysis Modules
These modules identify CpGs that are differentially methylated between experimental or biological groups.
Name |
Description |
Differential CpG analysis using the Bayesian approach. (for 450K/850K data) |
|
Differential CpG analysis using the beta-binomial model. (for RRBS/WGBS count data) |
|
Differential CpG analysis using Fisher’s Exact Test. (for RRBS/WGBS count data) |
|
Differential CpG analysis using the GLM generalized liner model. (for 450K/850K data) |
|
Differential CpG analysis using logistic regression model. (for RRBS/WGBS count data) |
|
Differential CpG analysis using Mann-Whitney U test for two group comparison, and the Kruskal-Wallis H-test for multiple groups comparison. |
|
Differential CpG analysis using T test. (for 450K/850K data) |
1.4. Predictive Modules
These modules aim to predict phenotypes or biological attributes from DNA methylation profiles.
Name |
Description |
Predict sex based on the semi-methylation (also known as genomic imprinting) ratio. |