18. beta_profile_region
18.1. Overview
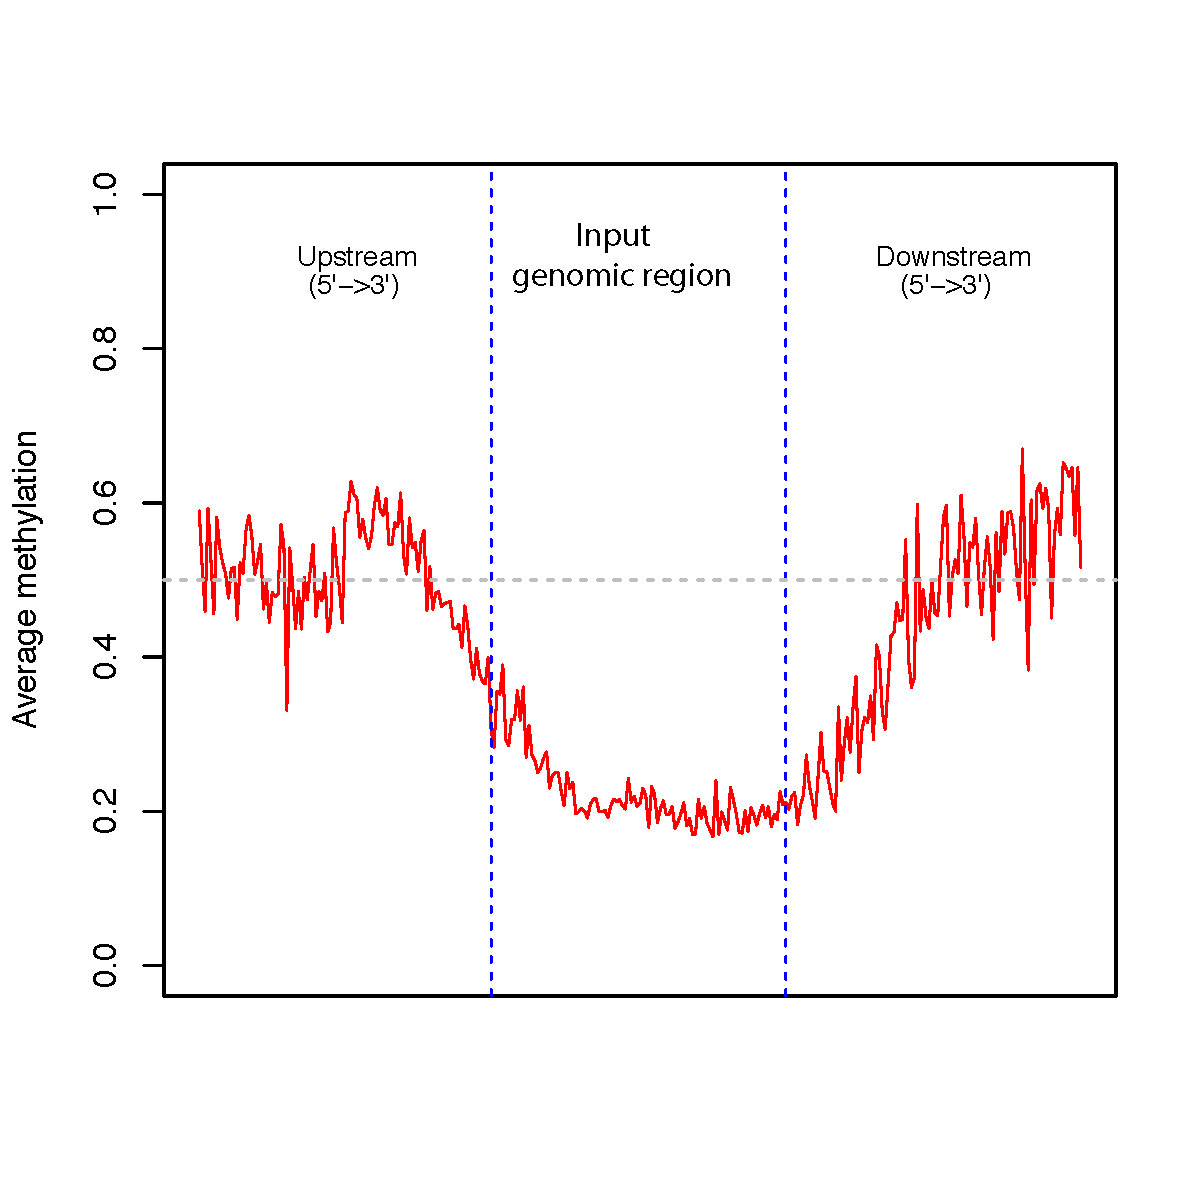
beta_profile_region generates a strand-aware DNA methylation profile
across user-defined genomic regions and their upstream/downstream flanks.
Profiles are normalized and oriented 5’ to 3’ relative to the strand of each target region. Three profile groups are reported:
upstream flank
target region
downstream flank
18.2. Input Files
18.2.1. Methylation file
The methylation input must be BED6 or BED6+ with Beta-values in column 5.
The first six columns are expected to represent:
chrom, start, end, name, Beta_value, strand
Example:
chr22   44021512    44021513    cg24055475    0.9231    -
chr13   111568382   111568383   cg06540715    0.1071    +
chr20   44033594    44033595    cg21482942    0.6122    -
Compressed input is supported when supported by the CpGtools reader.
18.2.2. Region file
The target-region input must be BED3 or BED3+. If column 6 is present, it is
used as the strand. If strand is absent or is not + or -, the region
is treated as being on the + strand.
Example:
chr1    15864    15865
chr1    18826    18827
chr1    29406    29407
Exact duplicate target intervals are removed while preserving input order.
18.3. Usage
Basic usage:
beta_profile_region \
    -r hg19.RefSeq.union.1Kpromoter.bed.gz \
    -i test_02.bed6.gz \
    -o region_profile
By default, 2,000 bp are profiled upstream and downstream of each target region.
Useful options include:
-u,--upstream– upstream flank length in bp (default: 2000)-d,--downstream– downstream flank length in bp (default: 2000)--format {png,pdf,both}– plot output format (default:pdf)--dpi– PNG resolution (default: 300)--width– plot width in inches (default: 8)--height– plot height in inches (default: 5)--no_plot– write the profile table without generating a plot-o,--out_prefix,--output– output prefix
Display all options with:
beta_profile_region -h
18.4. Output
For output prefix region_profile, the command always writes:
region_profile.region_profile.tsv– normalized methylation profile
The table contains:
Group–Upstream_region,User_region, orDownstream_regionRelative_position(5'->3')– normalized position within each profile groupAverage_beta– average methylation value
Unless --no_plot is used, the command also writes one or more plots:
region_profile.region_profile.pdfregion_profile.region_profile.png
Use --format both to generate both plot formats.
18.5. Example Data
18.6. Example Figure