1. Input File and Data Format
1.1. BED File
The BED (Browser Extensible Data) format is commonly used to describe blocks of genomic regions. Each line in a BED file represents one genomic feature and contains between 3 and 12 columns of data.
The BED format is 0-based, meaning the first base of a chromosome is numbered 0, and it follows a left-open, right-closed interval convention.
For example, the BED entry chr1 10 15 corresponds to the 11th to 15th bases of chromosome 1 (i.e., bases 11–15 inclusive).
BED Variants
BED12 file The standard BED format containing 12 fields. Each line represents a gene or a set of disconnected genomic regions. Detailed specifications are available here.
BED3 file Contains only the first three required fields:
chrom,chromStart, andchromEnd. Each line represents a single genomic region where score and strand information are not required.BED3+ file Contains at least three columns (
chrom,chromStart,chromEnd). Any additional columns will be ignored.BED6 file Includes the first six fields:
chrom,chromStart,chromEnd,name,score, andstrand. Each line represents a single genomic region and may include strand information or associated scores.BED6+ file Contains at least six columns (
chrom,chromStart,chromEnd,name,score,strand). Any columns beyond these six will be ignored.
—
1.2. Proportion Values
In bisulfite sequencing (e.g., RRBS or WGBS), the methylation level of a CpG site or region is represented by a proportion value.
A proportion value is a pair of integers separated by a comma (m,n), where:
m = number of methylated reads (
0 ≤ m ≤ n)n = total number of reads (
n ≥ 0)
For example:
0,10   1,27   2,159   # three hypo-methylated loci
7,7    17,19  30,34   # three hyper-methylated loci
—
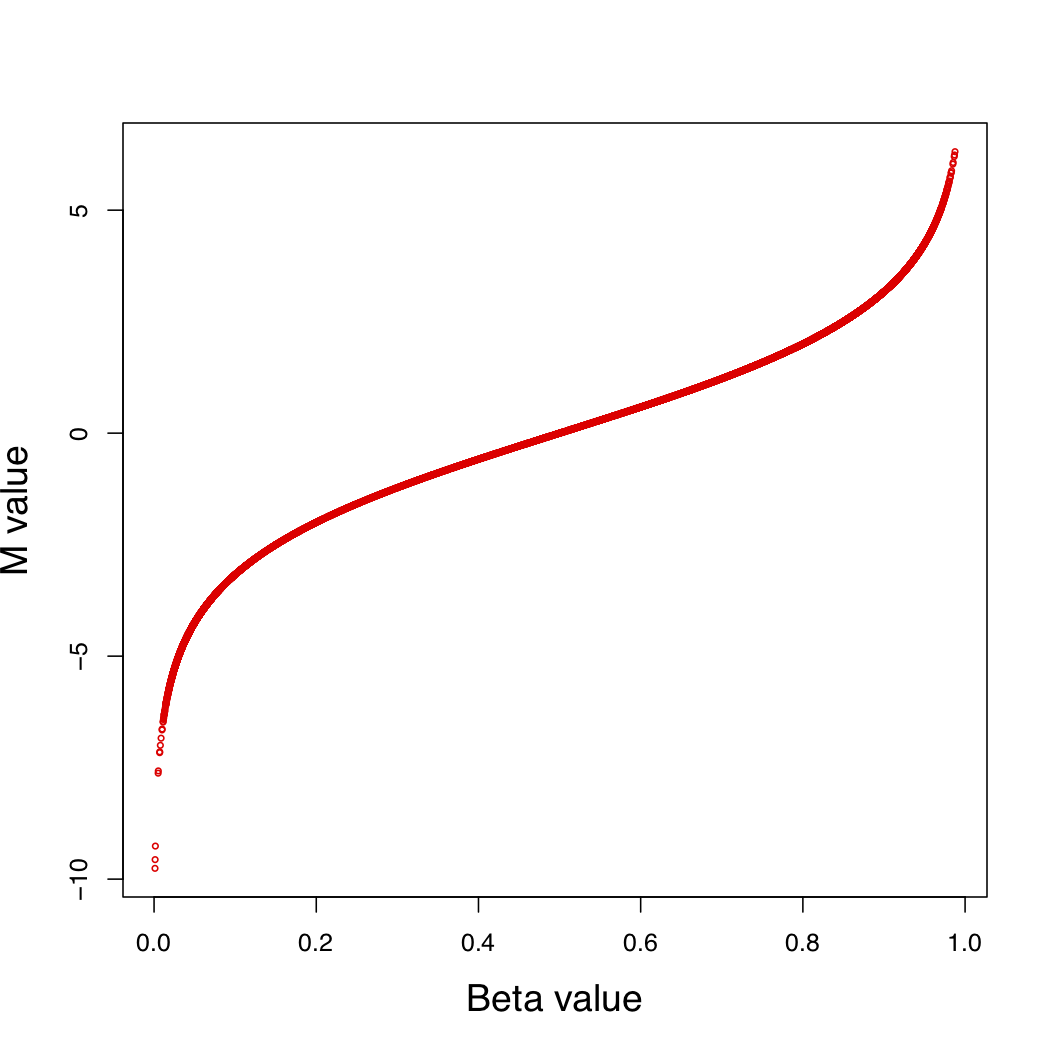
1.3. Beta Values
The Beta-value represents the proportion of methylation for a given CpG or locus. It ranges from 0 to 1, and can be interpreted as an approximation of the percentage of methylation.
A proportion value can be converted to a Beta-value, but not vice versa. In the equation below:
C = probe intensity or read count of the methylated allele
U = probe intensity or read count of the unmethylated allele
—
1.4. M Values
The M-value represents the log2 ratio of methylated versus unmethylated probe intensities (or read counts). It is calculated as follows:
C = probe intensity or read count of the methylated allele
U = probe intensity or read count of the unmethylated allele
w = offset (pseudo count) added to both numerator and denominator to prevent division by zero and reduce noise in low-coverage regions.
—
1.5. Convert Beta-value to M-value or vice versa
The relationship between Beta-value and M-value can be expressed as:
The following figure illustrates this relationship: