17. beta_profile_gene_centered
17.1. Overview
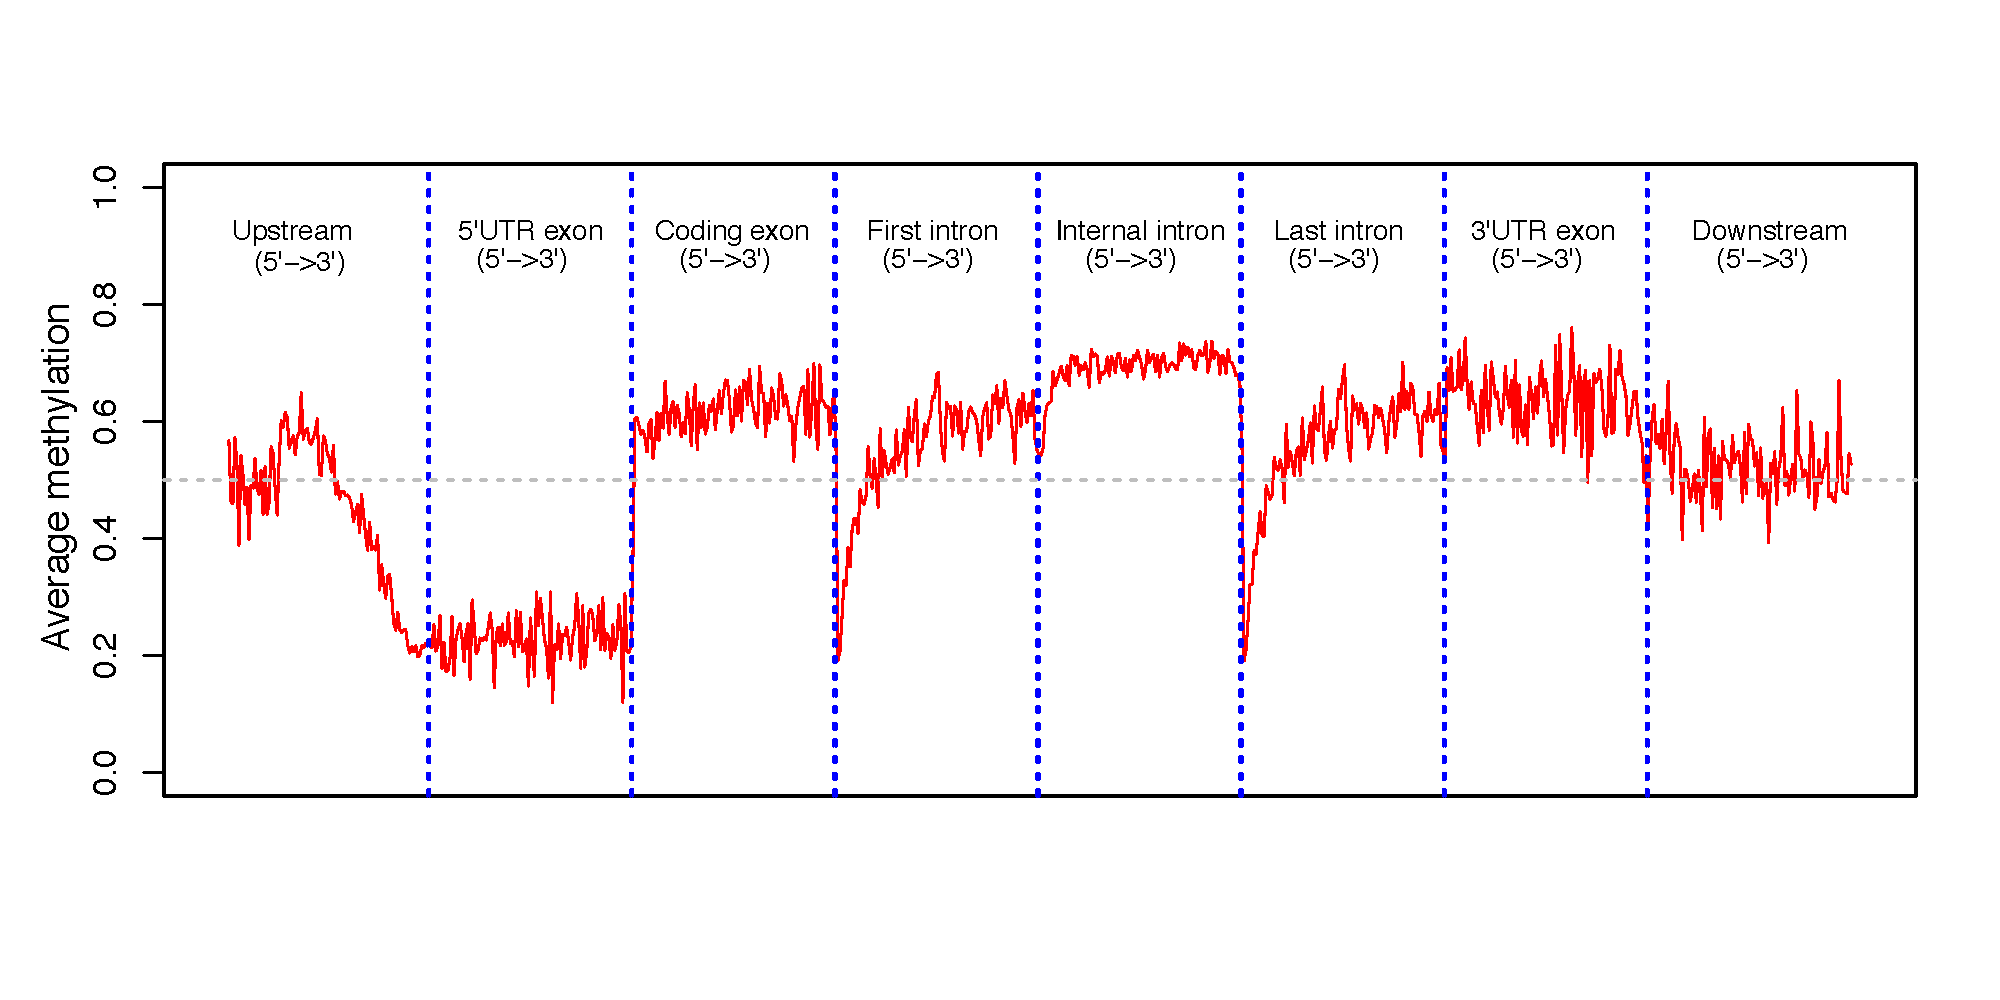
beta_profile_gene_centered generates a transcript-oriented DNA
methylation profile across major gene-centered genomic regions.
The profile summarizes average Beta-values across:
upstream intergenic regions
5’ UTR exons
coding exons
first introns
internal introns
last introns
3’ UTR exons
downstream intergenic regions
All regions are oriented from 5’ to 3’ according to transcript strand.
17.2. Input Files
17.2.1. Methylation file
The methylation input must be BED6 or BED6+ with Beta-values in column 5 and strand information in column 6. Compressed input is supported when supported by the CpGtools reader.
The first six columns are expected to represent:
chrom, start, end, name, Beta_value, strand
Example:
chr22   44021512    44021513    cg24055475    0.9231    -
chr13   111568382   111568383   cg06540715    0.1071    +
chr20   44033594    44033595    cg21482942    0.6122    -
17.2.2. Gene model
The reference gene model must be in BED12 format. Strand information is used to determine transcript orientation, UTRs, introns, and upstream/downstream regions.
17.3. Usage
Basic usage:
beta_profile_gene_centered \
    -i test_02.bed6.gz \
    -r hg19.RefSeq.union.bed.gz \
    -o gene_profile
By default, 2,000 bp are included upstream and downstream of each gene.
Useful options include:
-u,--upstream– upstream intergenic length in bp (default: 2000)-d,--downstream– downstream intergenic length in bp (default: 2000)--format {png,pdf,both}– plot output format (default:pdf)--dpi– PNG resolution (default: 300)--width– plot width in inches (default: 10)--height– plot height in inches (default: 5)--no_plot– write the profile table without generating a plot-o,--out_prefix,--output– output prefix
Display all options with:
beta_profile_gene_centered -h
17.4. Output
For output prefix gene_profile, the command always writes:
gene_profile.gene_centered_profile.tsv– normalized methylation profile
Unless --no_plot is used, it also writes one or more plots:
gene_profile.gene_centered_profile.pdfgene_profile.gene_centered_profile.png
Use --format both to generate both plot formats.
The profile table contains:
Group– genomic-region categoryRelative_position(5'->3')– normalized position within the regionAverage_beta– average methylation value
17.5. Example Data
17.6. Example Figure