18. beta_stacked_barplot.py
18.1. Description
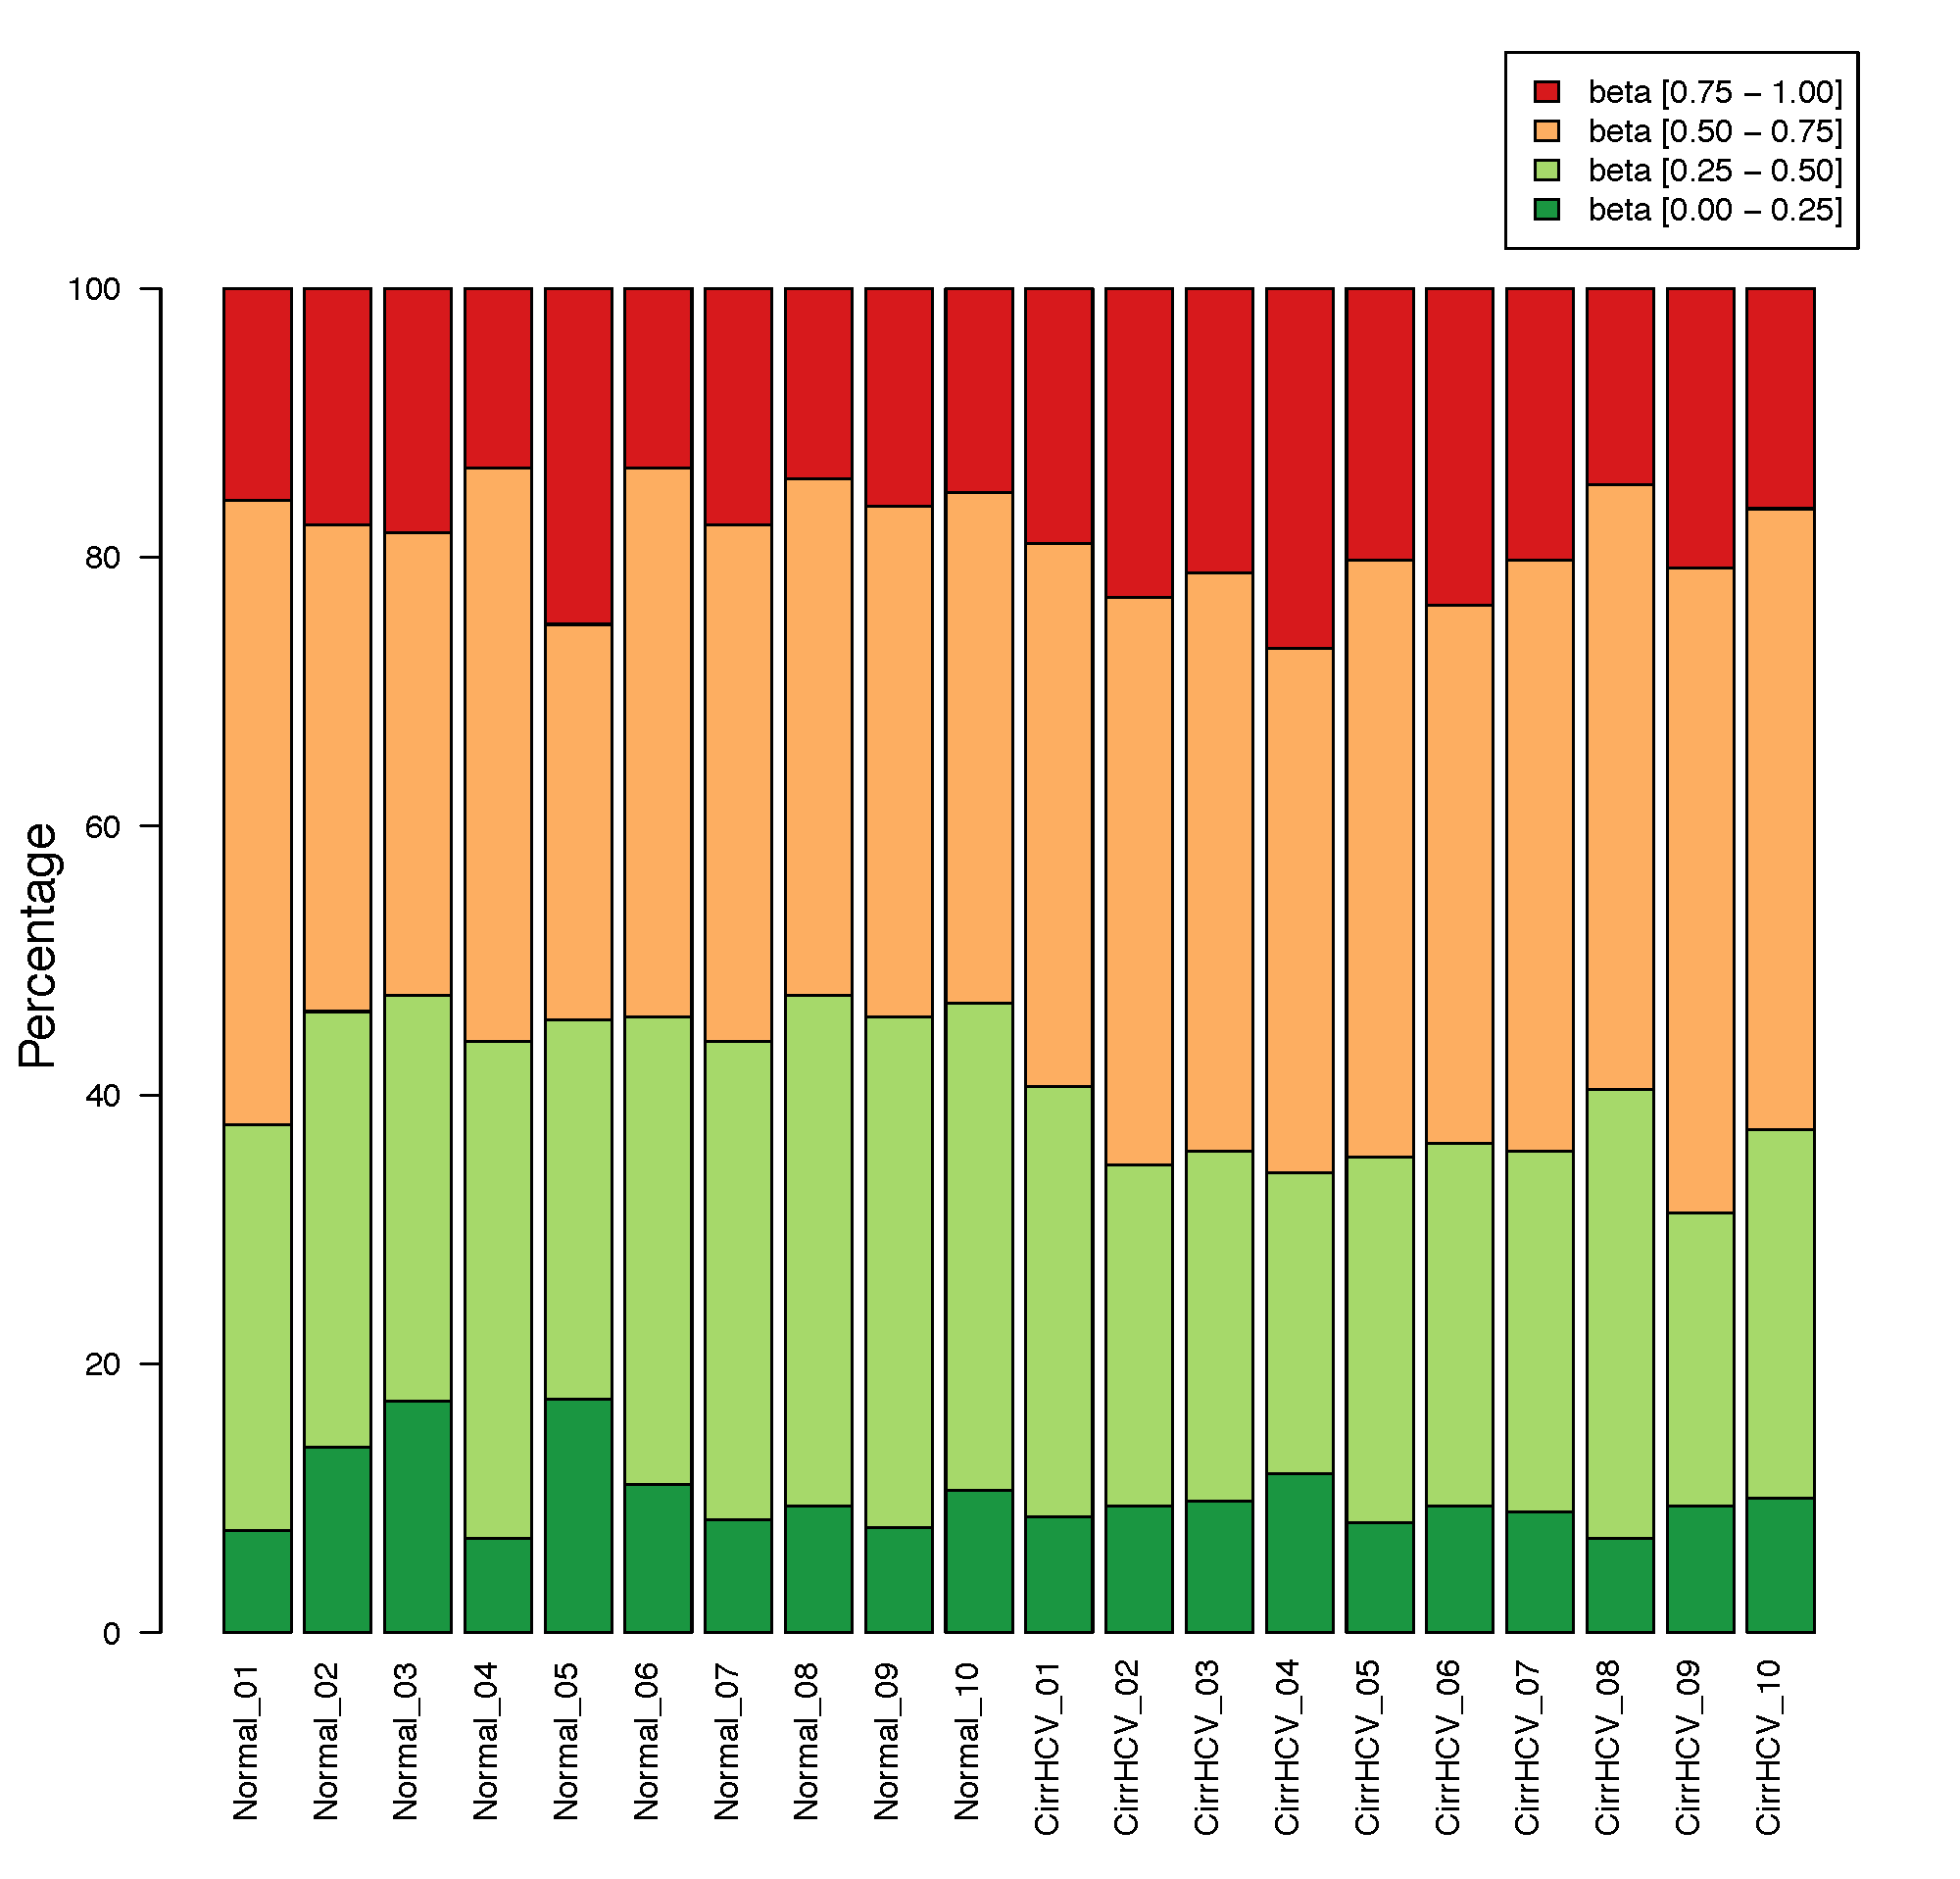
This program creates stacked barplot for each sample. The stacked barplot showing the proportions of CpGs whose beta values are falling into these four ranges:
[0.00, 0.25] #first quantile
[0.25, 0.50] #second quantile
[0.50, 0.75] #third quantile
[0.75, 1.00] #forth quantile
Example of input file
CpG_ID  Sample_01       Sample_02       Sample_03       Sample_04
cg_001  0.831035        0.878022        0.794427        0.880911
cg_002  0.249544        0.209949        0.234294        0.236680
Notes
Please name your sample IDs (such as “Sample_01”, “Sample_02” in the above example) using only “letters” [a-z, A-Z], “numbers” [0-9], and “_”; and your sample ID must start with a letter.
18.2. Options
- Options:
- --version
show program’s version number and exit
- -h, --help
show this help message and exit
- -i INPUT_FILE, --input_file=INPUT_FILE
Data frame file containing beta values with the 1st row containing sample IDs and the 1st column containing CpG IDs.
- -o OUT_FILE, --output=OUT_FILE
The prefix of the output file.
18.3. Input files (examples)
18.4. Command
$beta_stacked_barplot.py -i cirrHCV_vs_normal.data.tsv -o stacked_bar
18.5. Output files
stacked_bar.r
stacked_bar.pdf