11. beta_UMAP.py
11.1. Description
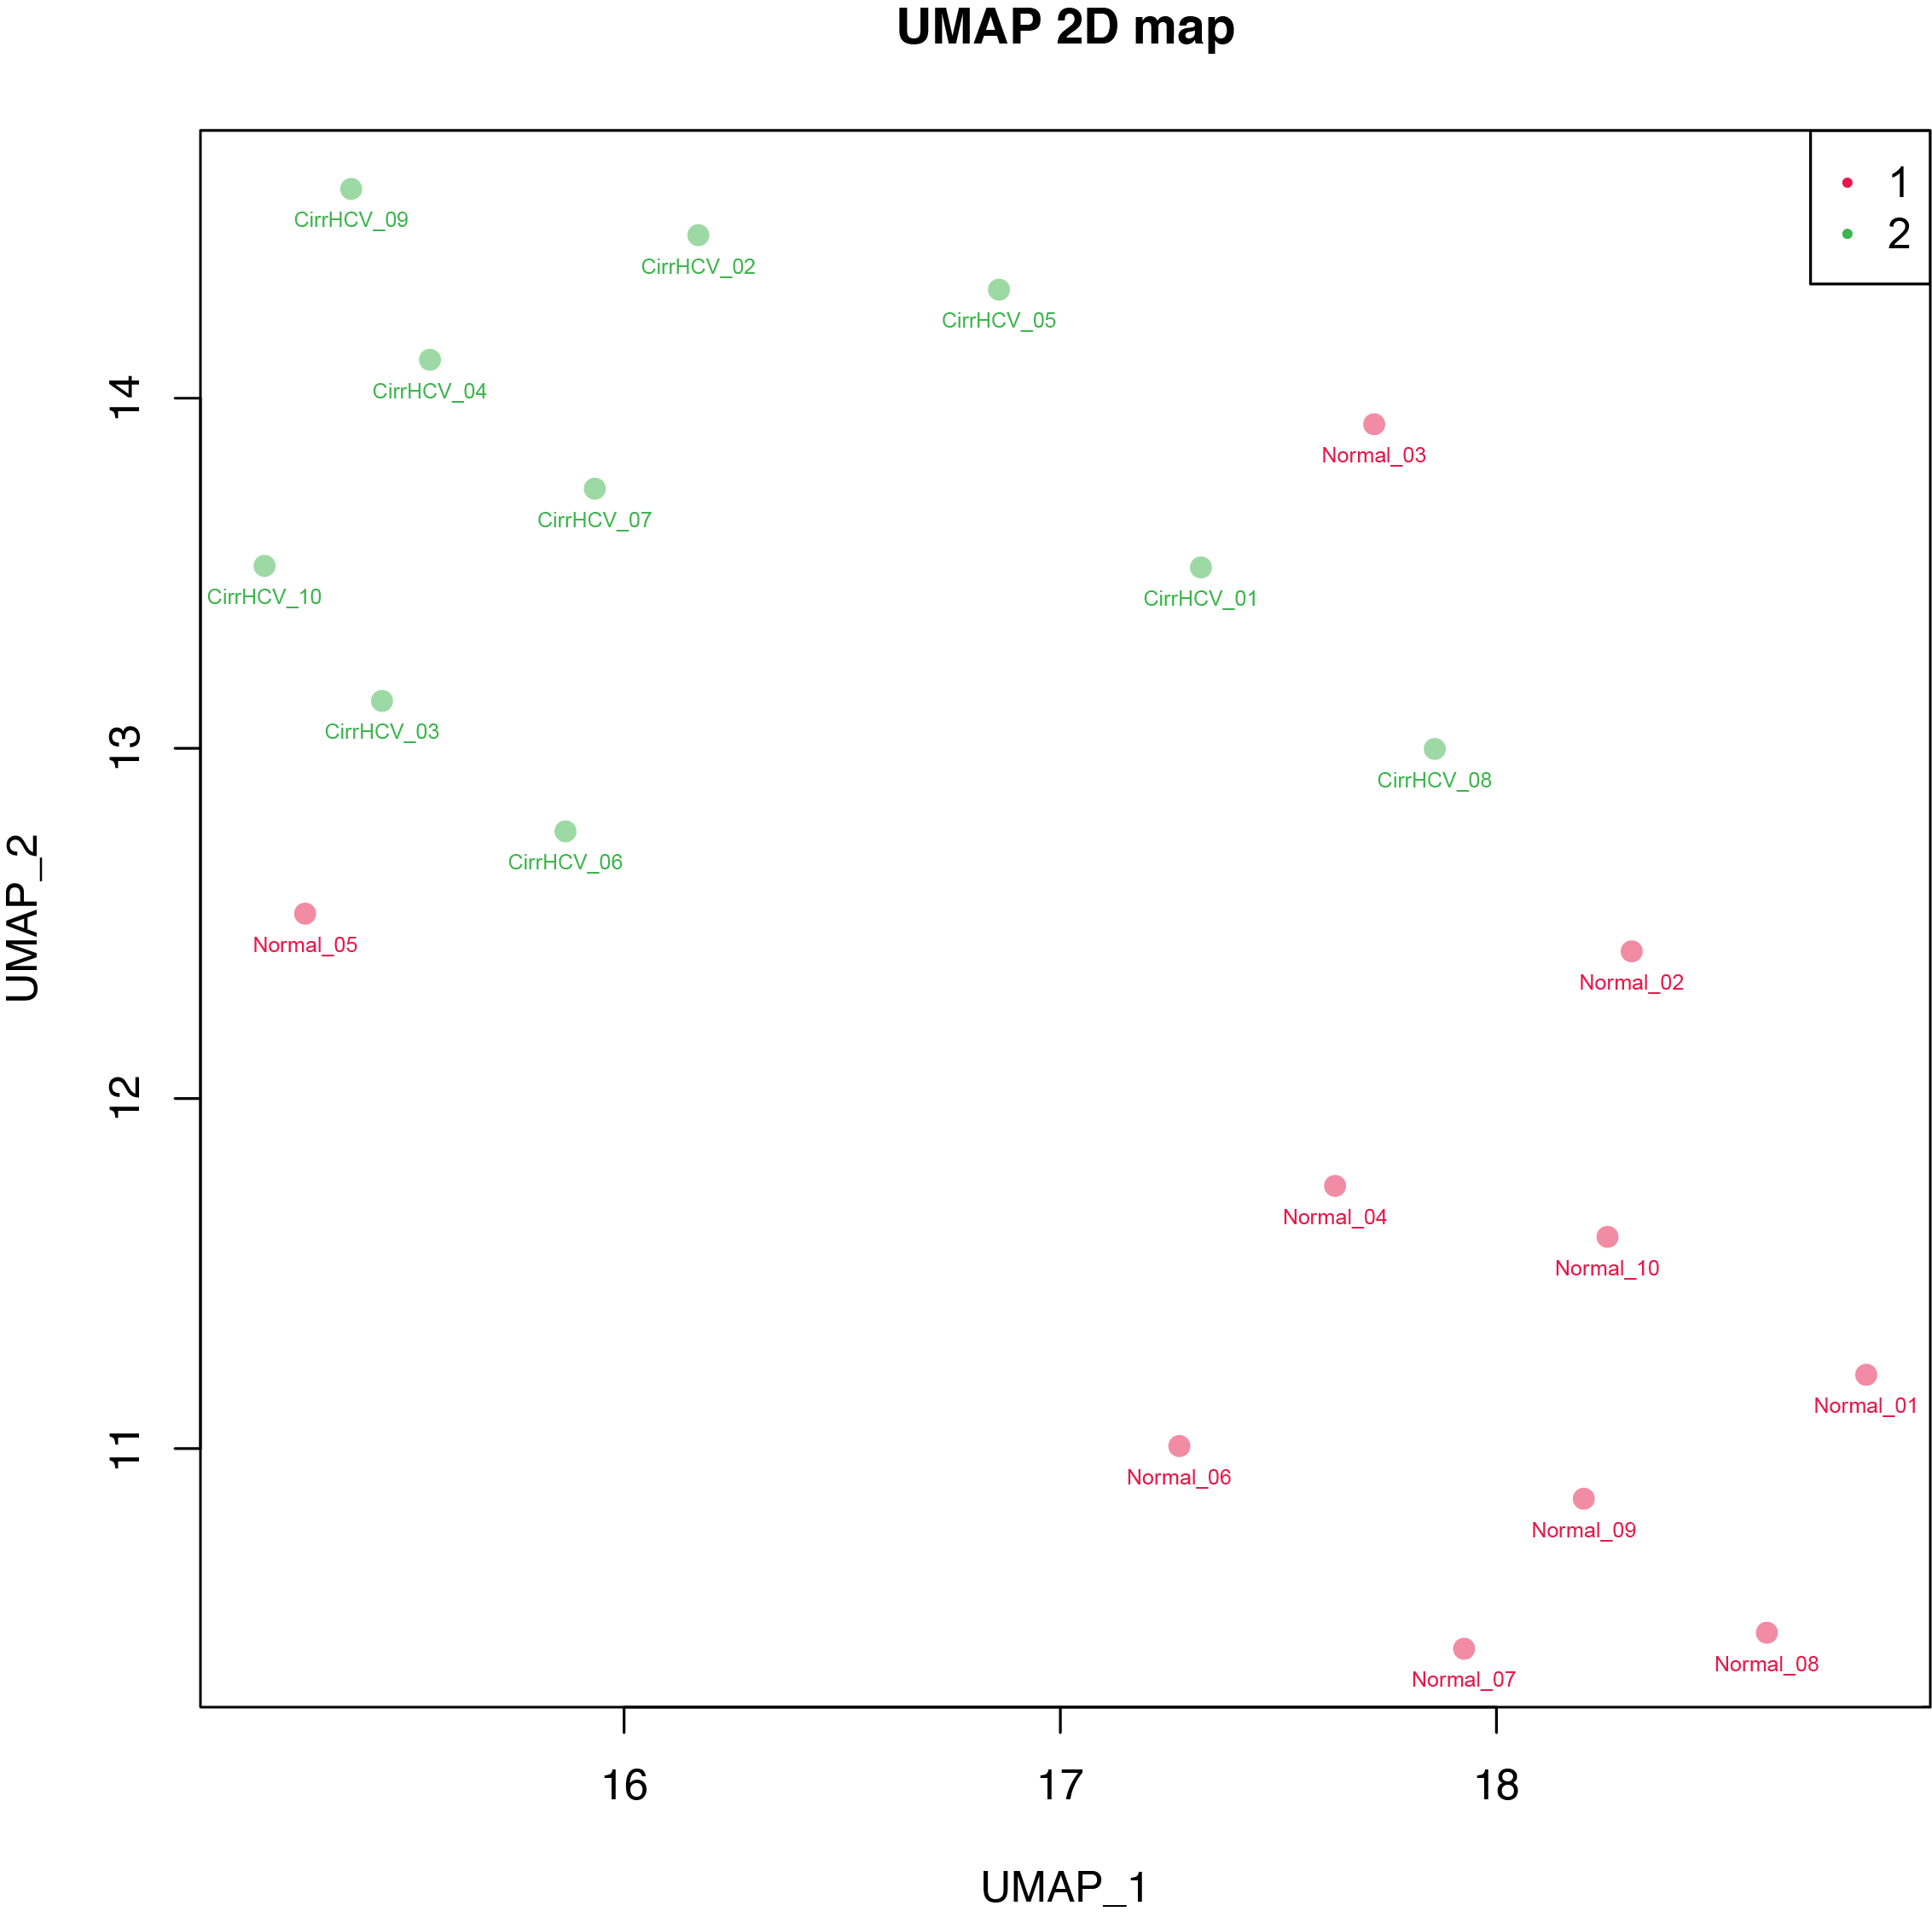
This program performs UMAP (Uniform Manifold Approximation and Projection) non-linear dimension reduction.
Example of input data file
ID     Sample_01       Sample_02       Sample_03       Sample_04
cg_001 0.831035        0.878022        0.794427        0.880911
cg_002 0.249544        0.209949        0.234294        0.236680
cg_003 0.845065        0.843957        0.840184        0.824286
...
Example of input group file
Sample,Group
Sample_01,normal
Sample_02,normal
Sample_03,tumor
Sample_04,tumo
...
Notes
Rows with missing values will be removed
Beta values will be standardized into z scores
Only the first two components will be visualized
- Options:
- --version
show program’s version number and exit
- -h, --help
show this help message and exit
- -i INPUT_FILE, --input_file=INPUT_FILE
Tab-separated data frame file containing beta values with the 1st row containing sample IDs and the 1st column containing CpG IDs.
- -g GROUP_FILE, --group=GROUP_FILE
Comma-separated group file defining the biological groups of each sample. Different groups will be colored differently in the 2-dimensional plot. Supports a maximum of 20 groups.
- -n N_COMPONENTS, --ncomponent=N_COMPONENTS
Number of components. default=2
- --nneighbors=N_NEIGHBORS
This parameter controls the size of the local neighborhood UMAP will look at when attempting to learn the manifold structure of the data. Low values of ‘–nneighbors’ will force UMAP to concentrate on local structure, while large values will push UMAP to look at larger neighborhoods of each point when estimating the manifold structure of the data. Choose a value from [2, 200]. default=15
- --min-dist=MIN_DISTANCE
This parameter controls how tightly UMAP is allowed to pack points together. Choose a value from [0, 1). default=0.2
- -l, --label
If True, sample ids will be added underneath the data point. default=False
- -c PLOT_CHAR, --char=PLOT_CHAR
Ploting character: 1 = ‘dot’, 2 = ‘circle’. default=1
- -a PLOT_ALPHA, --alpha=PLOT_ALPHA
Opacity of dots. default=0.5
- -x LEGEND_LOCATION, --loc=LEGEND_LOCATION
Location of legend panel: 1 = ‘topright’, 2 = ‘bottomright’, 3 = ‘bottomleft’, 4 = ‘topleft’. default=1
- -o OUT_FILE, --output=OUT_FILE
The prefix of the output file.
11.2. Input files (examples)
11.3. Command
$beta_UMAP.py -i cirrHCV_vs_normal.data.tsv -g cirrHCV_vs_normal.grp.csv -o cirrHCV_vs_normal -l
11.4. Output files
cirrHCV_vs_normal.UMAP.r
cirrHCV_vs_normal.UMAP.tsv
cirrHCV_vs_normal.UMAP.pdf