10. beta_PCA.py
10.1. Description
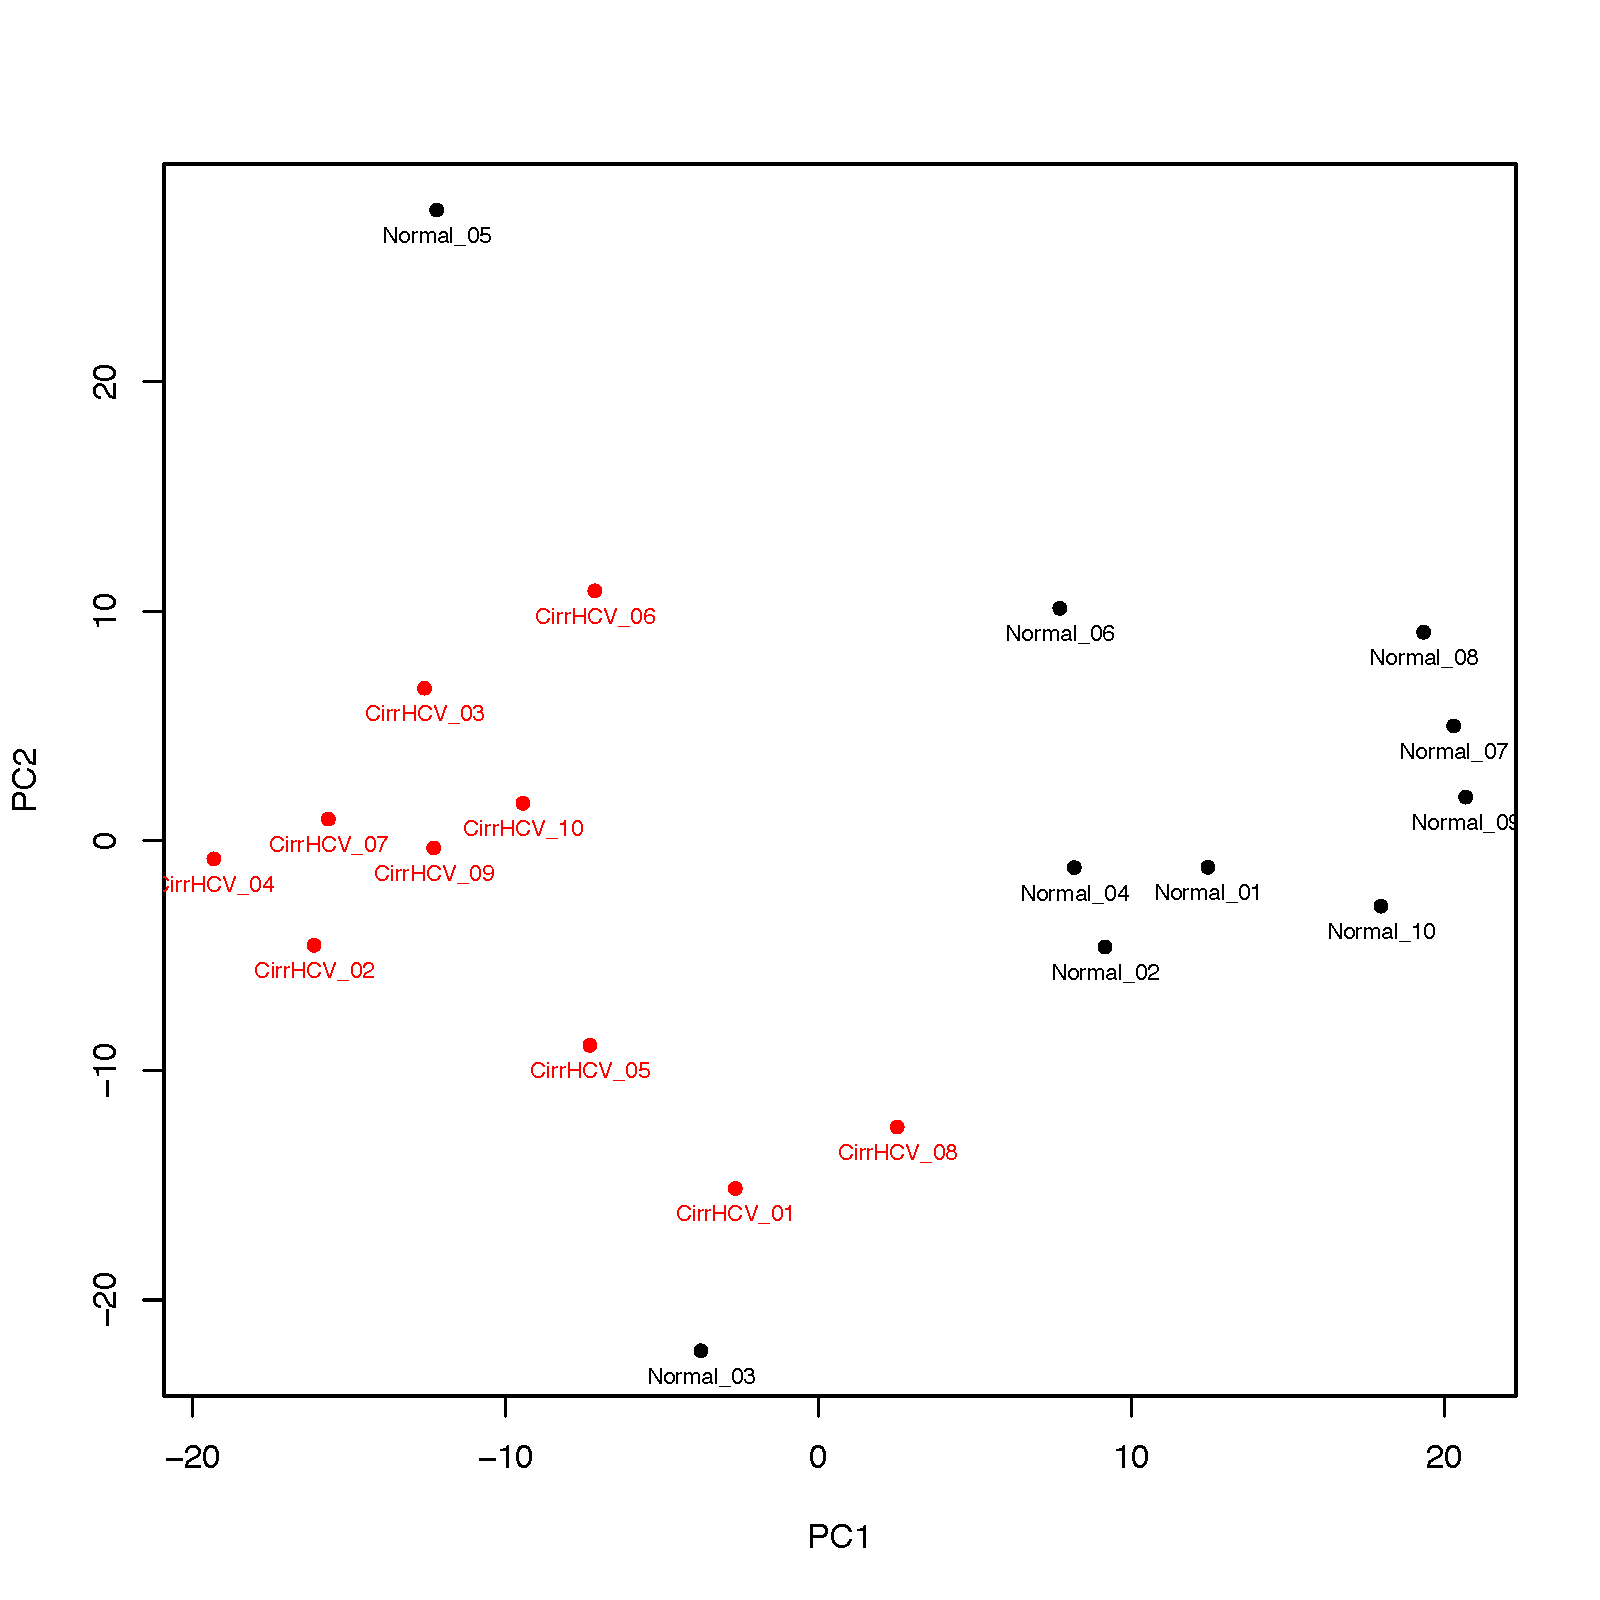
This program performs PCA (principal component analysis) for samples.
Example of input data file
ID     Sample_01       Sample_02       Sample_03       Sample_04
cg_001 0.831035        0.878022        0.794427        0.880911
cg_002 0.249544        0.209949        0.234294        0.236680
cg_003 0.845065        0.843957        0.840184        0.824286
...
Example of input group file
Sample,Group
Sample_01,normal
Sample_02,normal
Sample_03,tumor
Sample_04,tumo
...
Notes
Rows with missing values will be removed
Beta values will be standardized into z scores
Only the first two components will be visualized
Variance% explained by each component will be printed to screen
- Options:
- --version
show program’s version number and exit
- -h, --help
show this help message and exit
- -i INPUT_FILE, --input_file=INPUT_FILE
Tab-separated data frame file containing beta values with the 1st row containing sample IDs and the 1st column containing CpG IDs.
- -g GROUP_FILE, --group=GROUP_FILE
Comma-separated group file defining the biological groups of each sample. Different groups will be colored differently in the PCA plot. Supports a maximum of 20 groups.
- -n N_COMPONENTS, --ncomponent=N_COMPONENTS
Number of components. default=2
- -l, --label
If True, sample ids will be added underneath the data point. default=False
- -c PLOT_CHAR, --char=PLOT_CHAR
Ploting character: 1 = ‘dot’, 2 = ‘circle’. default=1
- -a PLOT_ALPHA, --alpha=PLOT_ALPHA
Opacity of dots. default=0.5
- -x LEGEND_LOCATION, --loc=LEGEND_LOCATION
Location of legend panel: 1 = ‘topright’, 2 = ‘bottomright’, 3 = ‘bottomleft’, 4 = ‘topleft’. default=1
- -o OUT_FILE, --output=OUT_FILE
The prefix of the output file.
10.2. Input files (examples)
10.3. Command
$beta_PCA.py -i cirrHCV_vs_normal.data.tsv -g cirrHCV_vs_normal.grp.csv -o HCV_vs_normal
10.4. Output files
HCV_vs_normal.PCA.r
HCV_vs_normal.PCA.tsv
HCV_vs_normal.PCA.pdf